Australian Global Warming skeptic, Simon Turnill, has just published a funny, yet frightening, piece following up on this revelation. He lays out an 8-step plan of the [modified] Scientific Method purportedly followed by fellow Australians, John Cook & Stephan Lewandowsky.
Read through it and see how many of the same tactics are employed by Suzuki et al on this continent.
The Sound Of Settled Science
Christopher Monckton of Brenchley;
“I am an expert reviewer for the Fifth Assessment Report of the Intergovernmental Panel on Climate Change. I wrote to you two weeks ago to report a serious error in the Fourth Assessment Report. I have had no reply. My letter of two weeks ago is attached, together with a copy of a letter I have sent to the Inter-Academy Council asking it to use its good offices to persuade you to reply. I have also sent a letter, for information only at this stage, to the police in Geneva, since it appears that a fraud may have been committed by the IPCC.”
h/t Maz2
The Sound Of Settled Science
Climategate 3.0
Roger at Tallbloke’s Talkshop here has gotten a letter from CRU lawyers suggesting he not mess around with the recently released Climategate e-mails, which are accessible using a password. The CRU apparently is very concerned about personal data ending up in public…
With advice from Lord Christopher Monckton.
The Sound Of Settled Science
Climategate 3.0
Things You’ll Never See On The CBC
Old Mann, New Trick

(Quick summary here.)
The World Is Being Run By Crazy People
And one of them is Rajendra Pachauri.
A Preview of Michael Mann’s Lawsuit?
Graham Redfearn is a “climate journalist” in Australia and an intellectual comrade of the infamous Michael Mann of Pennsylvania State University. Mr. Redfearn loves to compare anyone who questions him with Holocaust Deniers. He also isn’t very happy having to comply with Australia’s Freedom of Information Laws. Poor darling.
One can only wonder what hysteria Mann will exude once the lawyers of the National Review and Mark Steyn start demanding information, which is their legal right since Mann is suing them for defamation.
You can follow Mann’s privileged life here. He sure does a lot of traveling, doesn’t he? Must be pretty cool to be able to travel around without burning any hydrocarbons … oh wait.
Update: Michael Mann’s university name corrected – thanks to John Lewis
What Could Possibly Go Wrong?
When you start throwing money around for free?
Y2Kyoto: Gleick-Out
During the third week of February our global community of Earth and space scientists witnessed the shocking fall from grace of an accomplished AGU member who betrayed the principles of scientific integrity. In doing so he compromised AGU’s credibility as a scientific society, weakened the public’s trust in scientists, and produced fresh fuel for the unproductive and seemingly endless ideological firestorm surrounding the reality of the Earth’s changing climate.
John O’Sullivan Goes Above And Beyond
It’s slipped past most skeptics with all the action lately, but John O’Sullivan is putting in above and beyond what any single skeptical soul ought to.
He’s already been a key figure helping Tim Ball in the legal fight with the UVA establishment, which has spent over a million dollars helping Michael Mann to hide emails. The case was launched by Michael Mann, but could turn out to do a huge favor to skeptics — the discovery process is a powerful tool, and we all know who has been hiding their methods, their data, and their work-related correspondence.
Tim Ball and John O’Sullivan are helping all the free citizens of the West. The burden should not be theirs alone. There are many claims for help at the moment, but that is a sign that the grand scam is coming to a head.
More at the link.
Lizzie May: “[Canada is] Just as Awful as We Always Seemed”
Canada’s most infamous watermelon doesn’t hold back in expressing just how much she abhors her country. Although, in fairness, it’s not clear whether she has given up her Canadian citizenship and become a resident of Tuvalu. Here’s hoping.
The Cries of the Desperate
If you’re skeptical of AGW theory then, according to Al Gore, not only are you a “denier” (akin to Holocaust denier) but you’re also much like a racist:
One would think that some of the more intelligent environmentalists would much prefer if Gore just shut up. He truly is hurting “his side” … big time.
Update: Reportedly some aren’t able to watch the video. You can also see it here.
Update 2: Ezra Levant & Lorrie Goldstein discuss Gore’s assertion around 2 minutes into this video. And Charles Adler discusses it here.
A Cold Shower on the Heated Climate Rhetoric
Rex Murphy has a stellar editorial on Al Gore and the other Climategate fraudsters. h/t chutzpahticular
Y2Kyoto: This Is Awkward
A federal wildlife biologist whose observation in 2004 of presumably drowned polar bears in the Arctic helped to galvanize the global warming movement has been placed on administrative leave and is being investigated for scientific misconduct, possibly over the veracity of that article.
And then there’s that problem with the sheep…
Green Policy: Keeping more & more teachers unemployed every year!
SDA reader, David, provided a link to a very interesting article. Even though the Vancouver School Board has an $8.4-million funding shortfall, they have to buy $405,725 worth of carbon offsets as per provincial government legislation instituted by BC’s last premier, Gordon Campbell.
Lest anyone forget, the Greens among us have frequently said that “going green” won’t cost us anything. Well, in this case 5 teachers are going to lose their jobs in order to pay for these absolutely ridiculous carbon offsets.
The arrangement with the provincial government will see the money going to Encana, a billion dollar drilling company.
No Green evangelist can condemn this because it’s exactly what they’ve been pushing for all of these years! And Campbell bought into it hook, line, & sinker. He’s now gone but the powers at be will be scared to ever change things for fear of getting demonized by the Green Lobby. What would be beyond sweet would be to see both parents of school children and the BC Teacher’s Federation publicly condemning the Greenies!
Related: The founder of Encana is closely affiliated with BC’s current premier, Christy Clark. And make no mistake, if when the NDP ever gets back in power in this province, it’ll be the same or worse.
Update: BC Hospitals are not immune either. (h/t pkuster)
Cooking Kirensk
Earlier today Steve McIntyre posted a paper drawing attention to a discrepancy in the CRU’s treatment of Siberian temperature series may have a tendency to overstate the warming trend.
It turns out this was one of those papers that Phil Jones went to town on to keep critical papers out of the published literature. In that paper it mentioned the rural station of Kirensk as one that should be looked at because it has a long record and isn’t subject to urban heat island effects. This is interesting because this station is one that the CRU released as part of their subset of recently released data and it is available in the GHCN records.
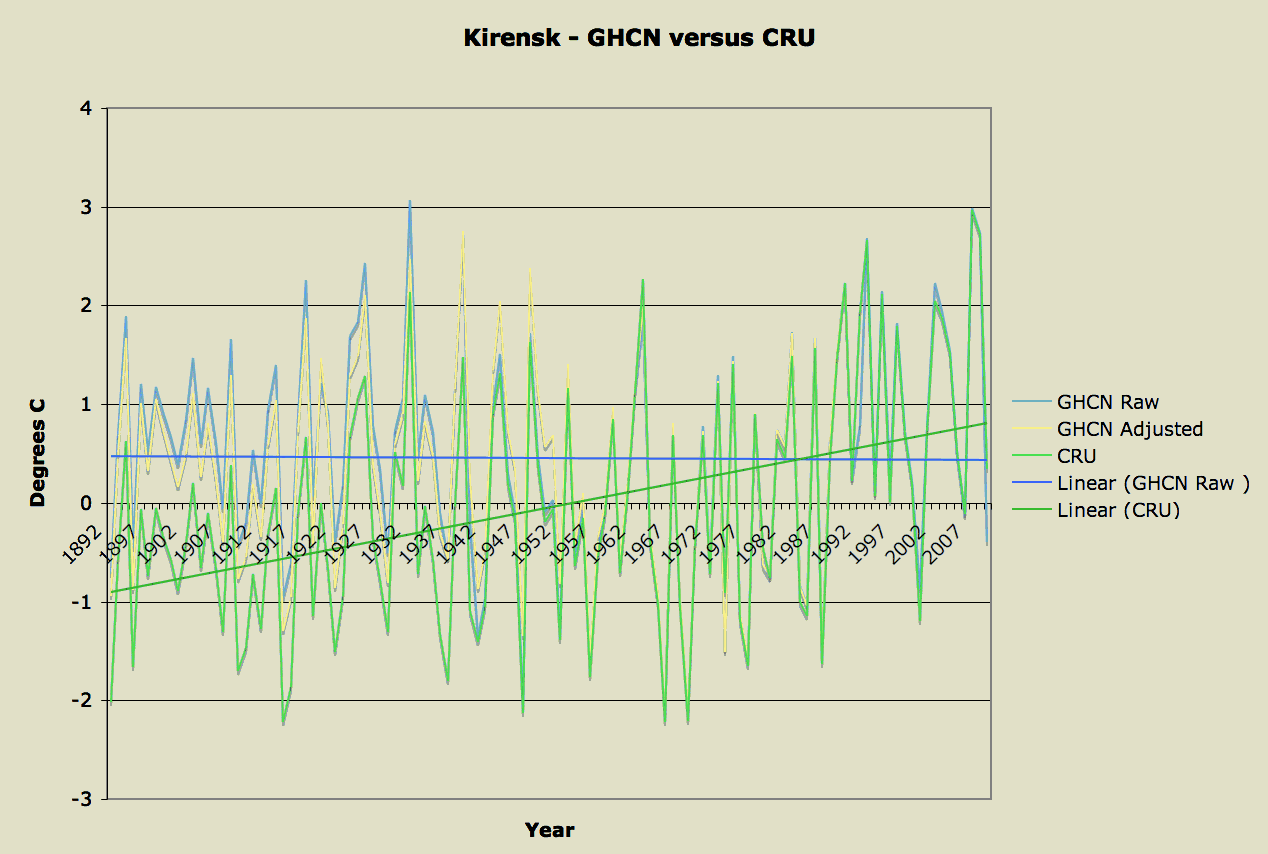
So I downloaded the data for both and compared them:

As you can see the GHCN and CRU versions agree fairly closely from about 1950 but CRU has a noticeable warming trend because it is significantly colder in the past. How they justify this sort of adjustment is interesting but unknown since they don’t release their methods. I assume this is some sort of homogeneity adjustment that aligns the trend of this station with neighbours (which may be increasing due to urban effects).
Also note that GHCN also has an “adjusted” series for this station, but those adjustments are minor – usually less than 1/10 of a degree.
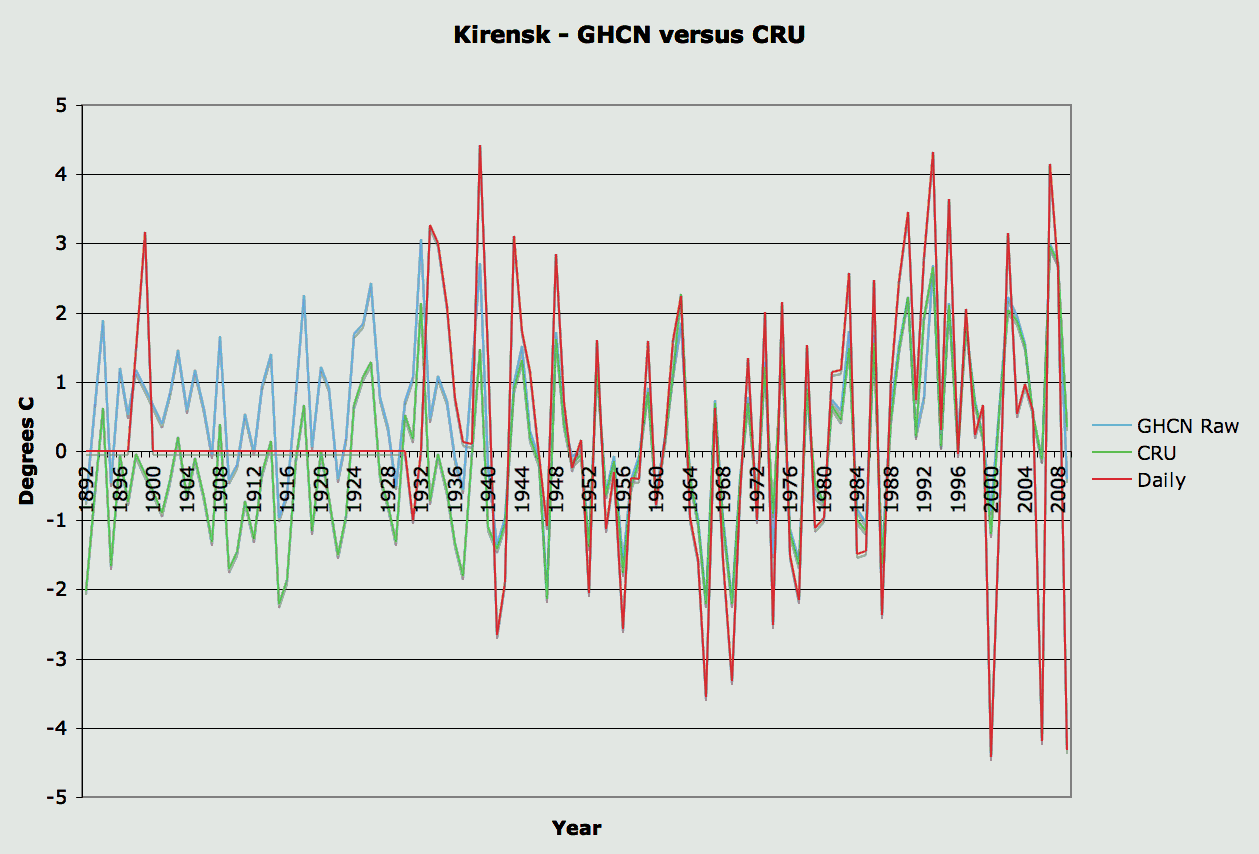
That graph provides no less than three temperature series for one station, but it doesn’t tell us which one (if any) are actually right. There is actually one more series for that station, and that is the GHCN Daily measurements. The other series are already monthly averages, and have been processed somewhat. The daily observations, on the other hand, are supposedly completely raw, recording exactly what Ivan wrote down on his form as he trudged out into the Siberian winter to read the thermometer.
Unfortunately, that data is missing the records for the early part of the century, but plotting it is interesting nonetheless:

The station reliably reported from about 1935 to about 1999, after which it has a large number of missing values, which would explain the larger variance from the year 2000 on. Presumably CRU and GHCN estimate the missing days from neighbouring stations and calculate the monthly values from a mix of real observations and estimates.
But both CRU and GHCN show smaller variances from 1935 to 1999, too, even though there are essentially no missing values to estimate. So it appears that even the GHCN “raw” data isn’t really raw, but has been subjected to a degree of homogenization.
So what is the “real” temperature trend of Kirensk and, by extension, southern Siberia? It looks like it can be whatever you want it to be.


