Why this blog?
Until this moment I have been forced to listen while media and politicians alike have told me "what Canadians think". In all that time they never once asked.
This is just the voice of an ordinary Canadian yelling back at the radio -
"You don't speak for me."
email Kate
Goes to a private
mailserver in Europe.
I can't answer or use every tip, but all are appreciated!


Katewerk Art
Support SDA
Paypal:
Etransfers:
katewerk(at)sasktel.net
Not a registered charity.
I cannot issue tax receipts
Favourites/Resources
Instapundit
The Federalist
Powerline Blog
Babylon Bee
American Thinker
Legal Insurrection
Mark Steyn
American Greatness
Google Newspaper Archive
Pipeline Online
David Thompson
Podcasts
Steve Bannon's War Room
Scott Adams
Dark Horse
Michael Malice
Timcast
@Social
@Andy Ngo
@Cernovich
@Jack Posobeic
@IanMilesCheong
@AlinaChan
@YuriDeigin
@GlenGreenwald
@MattTaibbi
Support Our Advertisers

Sweetwater

Don't Run

Polar Bear Evolution

Email the Author
Wind Rain Temp
Seismic Map
What They Say About SDA
"Smalldeadanimals doesn't speak for the people of Saskatchewan" - Former Sask Premier Lorne Calvert
"I got so much traffic after your post my web host asked me to buy a larger traffic allowance." - Dr.Ross McKitrick
Holy hell, woman. When you send someone traffic, you send someone TRAFFIC.My hosting provider thought I was being DDoSed. - Sean McCormick
"The New York Times link to me yesterday [...] generated one-fifth of the traffic I normally get from a link from Small Dead Animals." - Kathy Shaidle
"You may be a nasty right winger, but you're not nasty all the time!" - Warren Kinsella
"Go back to collecting your welfare livelihood." - Michael E. Zilkowsky

Are you always this gullible Kate?
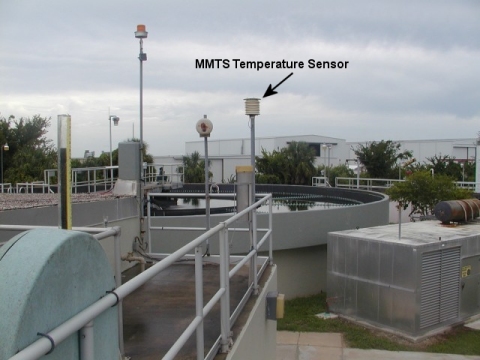
Wait I should give you a hint. This is two sewage treatment plants in a row with temperature sensors that you have been posted here now. Think about it. What other met hardware do you see? Why do you think people at a sewage treatment would need to know the local air temperature?
Jesus, you’re stupid.
What has gullibility got to do with it? This is one of the official USHCN sites that is used to tell us that we’re all gonna fry. Is that so hard to understand?
Alan
Fine, don’t answer the question.
Dude.
I don’t think Albatros clicked on the link, much less read it. For Albatros’s sake, I sincerely hope that’s the case.
As for the post itself, I’ve seen many examples of these special “global-warming”-attempting-to-prove temperature sensors being situated near heat sources. I lately visit SDA sporadically, but it seems that each and every time I’ve visited for as long as these posts are done, I find yet another.
This suggests to me that the DATA COLLECTION METHOD OF THE GLOBAL WARMING ALARMIST CONSPIRACY IS FATALLY FLAWED.
Talk about cheating to get the results one wants to back up one’s hypothesis. Now, isn’t that annoying?
Of course, with, reportedly, most university students cheating, is it any surprise that cheating and lying is approaching crisis levels elsewhere in society?
That gosh-darned left… the rascals! Whatever shall we do with them?
[Now I know there will be the usual critics who will jump in and say “This can be adjusted for!”.]
So who will do the “adjusting” ??
James Hansen ?
Maurice Strong ??
Suzuki ?
Dion ?
Chretien ?
Kinsella ?
After all, they are the ones that got us into this mess. And notice that they never come around and try to defend their actions, let alone the science. They just send trolls. (paid?) Can’t imagine anyone doing it because they beleive it.
Remember, because of cooked data like this, we have the Kyoto multi $Billion scam. Why do some people like scams ? Like being fleeced or something.
This is even better than the guy with the barbecue. I’m going to need to see an open flame next to the thermometer to beat this. ~:D
Albatross, it’s hard to tell if you’re REALLY as stupid as you’re making yourself out to be, or if you’re just playing the git, but I’ll try to explain it to you. The temperature readings that come from these sensors are what go into the claim that “We’re all doomed, and we’ll soon see polar bears on melting icebergs floating down mainstreet!!!”. Well, if they’re placing these sensors in locations that have machines pumping large amounts of heat into the immediate vicinity, or that have been changed from when they first began taking those measurements (for example, a paved lot that acts as a radiant source of heat), then those measurements are USELESS. Do you get it now?
BTW, Titusville is home to the Kennedy Space Centre. The place is wall-to-wall whenever there’s a Shuttle launch …..
…why blame Jesus?
These things are interesting and the data should be corrected, but for me the key is that even the poorly sited ones still show a trend similar to the GISS. John Van Vliet has done a great job. It is worthwhile pointing out that he actually used his own methodology and own code to produce the results.
John.
John Cross, could you look at this issue the other way around? From the perspective that the GISS shows a trend similar to poorly sited meteorological stations.
A meteorological station that cannot possibly record a temperature reading that is representative of the local area as a whole (which is therefore highly suspect and effectively useless) matches the GISS trend…leading one to believe that the GISS may be similarly flawed.
I’m sure if you were to plot the ups and downs of the stock market on a graph and compare it to the GISS, you’d likely get the same trend. What does that say…that capitalism is causing global warming?
Eeyore: But John V also plotted the sites that had been classified as 1&2 i.e. the best. They show an even closer match to the GISS.
In regards to the markets, no, I think pirates are a better explanation. 😉
Regards,
John
Alan at September 20, 2007 4:33 PM and sdc at September 20, 2007 5:56 PM
“This is one of the official USHCN sites that is used to tell us that we’re all gonna fry.”
Is it Alan? Is it the actual site or just a sensor that is part of an automated sewage treatment plant?
I’ve got a sensor in my backyard. Guess what, it’s not part of USHCN, but you can take pictures of it all you want and post them as if it was. There is one on top of the local elementary school just up the street (it’s on top of their roof too). Guess what, it’s not part of the USHCN either. In fact I know of five of these sensors in the local area. None of them are part of USHCN or even environment Canada.
Kate water treatment facilities need to know the temperature because it’s calculated in how much chlorine to add. The warmer it is, the faster the chlorine evaporates. Too much evaporation and the microbes don’t die. Too little evaporation and water goes down the pipe with too much chorine in it.
These photos are taken by and posted by anonymous people, you have no idea who owns these sensors or even if they are within a thousand miles of where this person claims they are. You will notice that “surfacestations.org” lists Titusville station as in a four digit lat and long of 28.62 N, 80.82 W. Listing a lat and long in this fashion allows for considerable error in locating a point on the earth’s surface, errors could be as much as several square miles.
The site of the sensor above in the photograph is actually located at 28,37’,27N, 80,48’,57”W . Titusville has two water treatment facilities with the error range, and other is located much closer to the “Arthur Dunn Air Park”. The photos are definately questionable.
Funny, here’s another at a water treatment facility.
http://www.norcalblogs.com/watts/2007/06/how_not_to_measure_temperature_10.html
Go back to making plans for sterilizing Africa Alby. You’re boring me.
John Cross, there is no possible way you could “correct” the data from this site. Ambient temperature where that sensor is will vary entirely independently of the general temperature (as measured by a proper site, for example.)
Any trend from that site will be measuring an increase in the use of that diesel generator, not the climate.
Umm Alby.
I worked in a waste treatment plant. They use chlorine gas to sterilize and it is all done underground after the water has been filtered. Temperature has nothing to do with it.
You remind me of the kid who takes his ball home when the game isn’t going your way.
Were you also beat-up at school as well?
Phantom: Another possibility is that the effect is not actually all that great. Looking specifically at the generator it actually looking at the image Aerial1, it doesn’t look that close.
We don’t know who’s interpretation is correct; yours or mine. So what we can do is look at the data. That is what John V has done and while his look is preliminary it seems to bear out that issues like this are not as great as have been made out.
Regards,
John
No matter what interpretation is used the bottom line remains the validity of the data. As it stands now I deem the data collection process invalid. If these devices were implaced for the local broadcast weather service it wouldn’t be that much of a problem. That is not the case. The data from these devices is being used for arguments concerning long term diviations of tenths or even hundreths of a degree.
If attempts are being made to measure to that degree of accuracy any station with 50 meters of a structure of any type or within 2 miles of a major habitation area should be considered suspect at best.
People argueing about how it can be “adjusted” for or how one facet of placement nullifies another facet are missing the point. Basic input data shouldn’t be SWAG’ed. It’s either basic data or it’s an assumption and therefore isn’t reliable for precise research being attempted. If they still insist on using it and using “educated” guesses at compensation then GIGO applies and you’ll be more likely correct if you use the Farmer’s Almanac.
Has alby ever won an argument here?
He has repeatedly come back for more and more abuse. Sorry, but this blog gets the traffic it does, and keeps it with the kind of, I dunno, truthlfullness that it reports.
Time and again, Alby will throw out some condensending tidbit(I’ll give you a hint)that never really materializes into fact.
This blog, this very popular blog is held to a very fine microscope by some very inteligent people(misguided yes, but smart).
Why is there so little concrete evidence of Kate’s failure? Scream all you want al. Change the subject and point out my grammer and spelling mistakes. Differ to a different item that you saw on another blog sometime last year(without a link of course) You just never win do you?
Could someone start keeping score?
Albatross @ 7:32pm
“You will notice that “surfacestations.org” lists Titusville station as in a four digit lat and long of 28.62 N, 80.82 W. Listing a lat and long in this fashion allows for considerable error in locating a point on the earth’s surface, errors could be as much as several square miles.”
What I notice, Albatross, is that you have not done a very good job of reading the data and presenting it to us.
The details of the Titusville reports are here:
http://gallery.surfacestations.org/main.php?g2_itemId=27674&g2_imageViewsIndex=1
where we are given very detailed co-ordinates for the site, plus observations.
The person making the report is clearly identified (not anonymous, as you have erroneously claimed) along with personal contact information if you would care to quiz him on the veracity of the data. Have you bothered?
Site Curator information and history of the site are also included in the report. Did you read it?
Alan
John Cross, here’s the problem. If a large number of sites over the last 30 years have been encroached upon by urban development, your data set is going to show an upward trend in temperatures. And many of these sites have been altered over time. Parking lot installed in the 80’s, AC installed in the 90’s, etc. To claim that the data from an individual site matches the upward trend of the whole dataset does not prove that there is a natural upward trend. The upward trend could just as easily be caused by the trend of urban encroachment on the data gathering stations, and I’m quite sure that they don’t adjust the data from individual sites for every change that happens in the nearby vicinity of that site.
The 47th time it has been explained to JC.
The concept of “adjusting” the data collected by any site in seriously flawed. Once you have to adjust … nothing taken from the site can be trusted; period … especially for the purpose of measuring changes over time at that site.
How in the world, is one to “adjust” for every little nuance of temperature change created as human structures and environmental variables are added over time.
So much for “peer review”.
“but for me the key is that even the poorly sited ones still show a trend similar to the GISS”.
The poorly sited ones more closely match the GISS trends.
Yes Paul, especially when they’re claiming the half-degree change as being so monumental. How can they “adjust” the data and be accurate to within a tenth of a degree?
“but for me the key is that even the poorly sited ones still show a trend similar to the GISS”.
“The poorly sited ones more closely match the GISS trends.”
The poorly sited ones are probably causing the GISS trends.
True science … the pure kind we learned about in university, would use truly controled raw data. For example, if one wants to compare temperature over 1000 years using tree rings … then only tree rings should be used … but not tree rings from fertilized, heated, and watered urban trees, least of all going from tree rings to thermometers.
The same goes for electronic sites … the environmental conditions around the site must remain the same … a site that’s gone from pastures to 2 million people just up wind is invalid for the purpose of measuring mean temp over time as a product of CO2 production. It is though, a perfect source for measuring surface temp over time as a function of human encroachment on the environment.
And, let’s keep in mind that all of these sites measure surface temp … which is quite irrelevant despite what AGW myth makers claim. The temps that counts are above 500 millibars; and those, incidently, haven’t warmed as much since the NOAA got into the business. Some believe that the upper air should warm first … after all, there supposed to be a “green house” effect .. no?
John Cross said: “We don’t know who’s interpretation is correct; yours or mine. So what we can do is look at the data. That is what John V has done and while his look is preliminary it seems to bear out that issues like this are not as great as have been made out.”
John, that’s true of course. The problem is that in order to know how big the effect is you’d have to have a trustworthy senor quite close to the bad one, like within a mile or so (I’d guess anyway, I’m a bone twister not a climate guy.)
We don’t have that. What we have is sensors -pretending- to be trustworthy.
If I measure the same stick of wood with five different rulers, all of which have been biased by various people, do I know how long the stick is? If I want to compare my stick to another one can I use a measurement or do I need to physically hold the sticks together to see which is longer?
We’re talking about 600+ stations here, an unknown (but growing!) number of which have been perverted by circumstance, stupidity or possibly enemy action. You think we can squeeze 1/2 degree accuracy out of that?
Lotta money and misery riding on that 1/2 degree John.
Pete: Sure, that is the typical argument. What Surfacestation.org has done is to go out and actually look at the sites. They assign a classification to each based on a standard (Class 1 being the best to Class 5 being the worst).
What John V did was to actually plot the trend of three things. Class 5 sites, the GISS and a combined Class1 and Class 2 sites. Now if the error was as you think, the class 5 sites should have had a large deviation from both the class 1 and the GISS trend. However that is not what is showing up in the data.
Paul, do you have a reference for your statement that “The temps that counts are above 500 millibars“.
Regards,
John
I think Alby is headed for a mental breakdown.
He keeps coming to a site he doesn’t like, keeps posting on a topic he’s quite ignorant about and adds nothing to the discussion.
Pete:
I was just curious as to why John didn’t notice the correlation.
missing link at September 20, 2007 8:00 PM
“worked in a waste treatment plant.”
That’s nice and does that mean you are familiar with all systems? Did you pre-chlorinate?
Alan at September 20, 2007 9:40 PM
“The person making the report is clearly identified (not anonymous, as you have erroneously claimed) along with personal contact information if you would care to quiz him on the veracity of the data. Have you bothered?”
That’s very nice, but the bottom line, who is verifying what is being posted?
Anyone, regardless of qualifications can post a photo of any location without the bother of verification.
Alan at September 20, 2007 9:40 PM says:
“The person making the report is clearly identified (not anonymous, as you have erroneously claimed) along with personal contact information if you would care to quiz him on the veracity of the data. Have you bothered?”
That’s very nice, but the bottom line, who is verifying what is being posted?
Anyone, regardless of qualifications can post a photo of any location without the bother of verification.”
I think you are referring to the IPCC report.
I heard some stuff today that has me spooked. I consider myself in the “deniers camp” so don’t confuse me with the “sky is falling group” ….
If the US implements a carbon emissions cap and quota system, you can bet that we Canadians are going to pay to modernize US industry. (Remember how leaded gas was phased out.)
We Canadians, whether we are “deniers”, environmentalists, or government, had better start “pulling our heads out of our @ss” or we will pay dearly.
Oh, Albatross, Albatross, Albatross. When will you do the basic research? All of the contact information is presented clearly. You can do just what I did, call the site Curator and get confirmation from him about the veracity of the photos. Or is my confirmation too “anonymous” for you to accept?
Alan
If indeed it’s a sewage or water treatment plant, the sensor is most likely hooked up to a computer. I would guess that recording average temperature is part of the system’s brain. One slight error in data, and they could be in shit!!
Alan
You are missing the point. That contacts information may or may not lead to the guy who actually took the photo. We don’t know who this guy is, what his qualifications are and if he knows what he’s doing. He says he took a photo of the correct sensor and in his mind he may in fact believe he did. Who has gone down to verify the guy’s accuracy? Like I said, there are other reasons for a sewage treatment plant to have weather instrument on site. One reason is to monitor the meteorological conditions while treating the water as I stated above, and second is to know what is happening with the weather in real time. You will notice just under the sensor in the photo there is a rain gauge. Can you think of a reason a SEWAGE treatment plant might want to know how much rain is falling? The instruments in the photo are for the plant operations and I have my doubts they are there for USHCN. There could very well be another site on the property where the proper site is located. Look at the Google earth image of the property and you will see there is a large green space on the site. Personally the first place I’d like to see is what is at 28°37’25.67″N, 80°48’59.25″W, 52 meters south-west of the original photographed sensor.
In short what is being done here people making claims against climate studies carried out by some of the world’s leading climate scientists who have assembled data. They have placed their names on and staked their reputations on the papers they have written and published their finding for other climate scientists to scrutinize. But at the same time you blindly take the word of some guy with a web page and digital camera with nothing to lose if he is wrong or lying.
jeff.k at September 20, 2007 9:38 PM
Yes, every one of them.
Albatross,
I am not missing the point, you are avoiding it. All of the contact information is there. If you are really skeptical, do the research yourself. Heck, you could even go there and do the site visit — the Curator sounded like a genial fellow, I’m sure he’d show you around. Let us know what that blotch is at 28°37’25.67″N, 80°48’59.25″W.
Alan
I’m not avoiding anything. He may be a genial fellow, but who is he really?
It’s up to the owner of the web site above to verify the accuracy of the contributors and the content of his site. He doesn’t do this. Anything less simply invalidates the quality of the information he presents.
The owner of surfacestations.org in his terms of service to anyone contributing to his site makes no mention of the required accuracy of the photos submitted. Anyone can contribute a photo with nothing more than filling out a simple form on the Surfacestations. They require absolutely no training or background knowledge to submit these photos. The only requirement to post an image on Surfacstation.org is a digital camera, access to a computer and a belief they are somehow disproving that the earth is warming.
This reminds me of is the UFO nuts running around pointing at every civilian airliner and swearing they have witnessed space aliens. One of the more famous being the Phoenix lights of 1997-
youtube.com/watch?v=gg6cGCAB2Ck
In truth anyone that has ever flown search and rescue in the air force knows what these lights are and they are not aliens. They are in fact LUU-2B/B air droppable parachute flares. Those wanting to believe they are aliens, which apparently includes CNN, refuse to listen to people who have correctly explained what is in the video.
So people who are photographing these temperature sensors may be doing the same thing. Refusing to suspect they could be anything else, they automatically believe every sensor they see must automatically be a USHCN sensor.
Yes Paul, especially when they’re claiming the half-degree change as being so monumental. How can they “adjust” the data and be accurate to within a tenth of a degree?
How? That’s easy: “The process is much too complicated for the average person to understand, so just take our word for it.”
“You need not look at our data-collection methods or the underlying code of the software or the hypothetical variables inputted, that would just confuse the issue.”
Ahem…
Albatross,
>
When I spoke of the Site Curator, I was not talking about the fellow who runs surfacestations.org, nor was I talking about the fellow who collected and posted the data.
I am talking about the fellow at whose site the weather station is located!!
>
And all the information is posted online so that the evidence can be fact-checked by anyone.
So far, your rebuttal to these reports amounts to not much more than: “I don’t like the conclusions that the evidence points to, therefore the person presenting the evidence is probably either corrupt or incompetent, both.”
All of the information about the Titusville station report is available to you. You can fact-check it all you want.
Until you make your own effort to research the evidence for this station, the evidence presented stands, unless augmented or refuted by further evidence.
“I don’t like it” is not a rebuttal, but it is petulant.
Alan
Ok time to put this to rest:
1) I run http://www.surfacestations.org
2) There are 1221 of these special climate stations used to monitor climate in the USA The network is a subset of the NOAA Cooperative Observer Network (COOP) The US Historical Climatological Network is what they are surveying. Our surveyors select from the USHCN master list, which you can see here: http://www.surfacestations.org/USHCN_stationlist.htm
3) From the MMS system of the National Climatic Data Center you can locate the station in Titusville just to be sure it is the same. http://mi3.ncdc.noaa.gov/mi3qry/login.cfm
use the guest login function then enter “Titusville” it is station 088942
4) Note that in our USHCN master list as well as the “Location” Tab of the NOAA MMS search system the location for station 088942 is given as:
“WATER TREATMENT PLANT WITHIN AND 3 MILES NNW OF PO AT TITUSVILLE FL”
PO stands for “Post office” its an old method for location that is still used today.
5) Also note that the “managing parties” tab is listed as “CITY OF TITUSVILLE” They operate the sewage treatment plant.
6) Lets look at the higher resolution coordinates supplied in the MMS database as well as the USHCN master list for Titusville: 28.62417N -80.81583W
7) Here is the Google Maps link with satellite view overlay, note the water treatment plant:
http://maps.google.com/maps?f=q&hl=en&geocode=&q=28.62417N+80.81583W&ie=UTF8&ll=28.620391,-80.808735&spn=0.022528,0.046778&t=h&z=15&iwloc=addr&om=1
8) here is a different search on the Water Treatment Plant by address which was taken from the City of Titusville website:
http://maps.google.com/maps?f=q&hl=en&geocode=&q=1105+Buffalo+Road,+Titusville,+FL&sll=28.58422,-80.788822&sspn=0.086222,0.113468&ie=UTF8&t=h&z=16&iwloc=addr&om=1
City website on the Osprey WWTP they operate, note the address:
http://www.titusville.com/SectionIndex.asp?SectionID=49
9) Here is the MS Live Maps aerial view, where you can see the location in detail, and just barely make out the MMST temperature sensor:
http://maps.live.com/default.aspx?v=2&cp=ns3mf287ys79&style=o&lvl=2&tilt=-90&dir=0&alt=-1000&scene=15654154&encType=1
10) Note from the USHCN master list as well as the “Equipment” tab on the NCDC MMS search that the USHCN station at that location uses an MMTS Electronic Thermometer. This is specially made for the NOAA COOP program (an hence also USHCN) and is not available for purchase by other agencies.
You can see a picture of one here:
http://www.crh.noaa.gov/lot/coop/equipment.php
And see specs for the MMTS system here:
http://www.srh.noaa.gov/ohx/dad/coop/mmts.html
Compare that to the sensor seen in the photos of the Titusville, WWTP they are identical.
Now Albatross, I know it may be hard for you to accept, but here is the last point:
According to the MMS database, and compiled in my slide show presented at UCAR, there are 68 USHCN official climate stations located at Waste Water Treatment Plants. http://gallery.surfacestations.org/UCAR-slides/page94.html
See the entire slide show here, and you’ll begin to understand the level of bias that has been introduced into the climate record:
http://gallery.surfacestations.org/UCAR-slides/index.html
Thanks Anthony, and allow me to apologize for the intrusion by “Albatross”. Most of us have learned to ignore him. He is a textbook internet troll – one of the downsides to giving your site broader exposure, I’m afraid.
Alby, like ok4ua, is usually doing the full out troll routine trying to discredit or deflect anything that is contrary to their world view. It does not matter how many times you point out the truth, they will not believe it. They are ecofascists and will not allow anyone to expose the ugly truth behind their religion/belief system. You can’t convince them but you can laugh at them, they really need another clue to rub against the only one they have left.