A sad reality of modern times is that debts are so huge that most people can’t grasp the extremely large (and long) numbers involved. To help those in the ‘Math is Hard’ crowd better understand why America’s Sequestration Debate has a complete premise problem from the get go, this pair of diagrams clearly illustrates the issue:
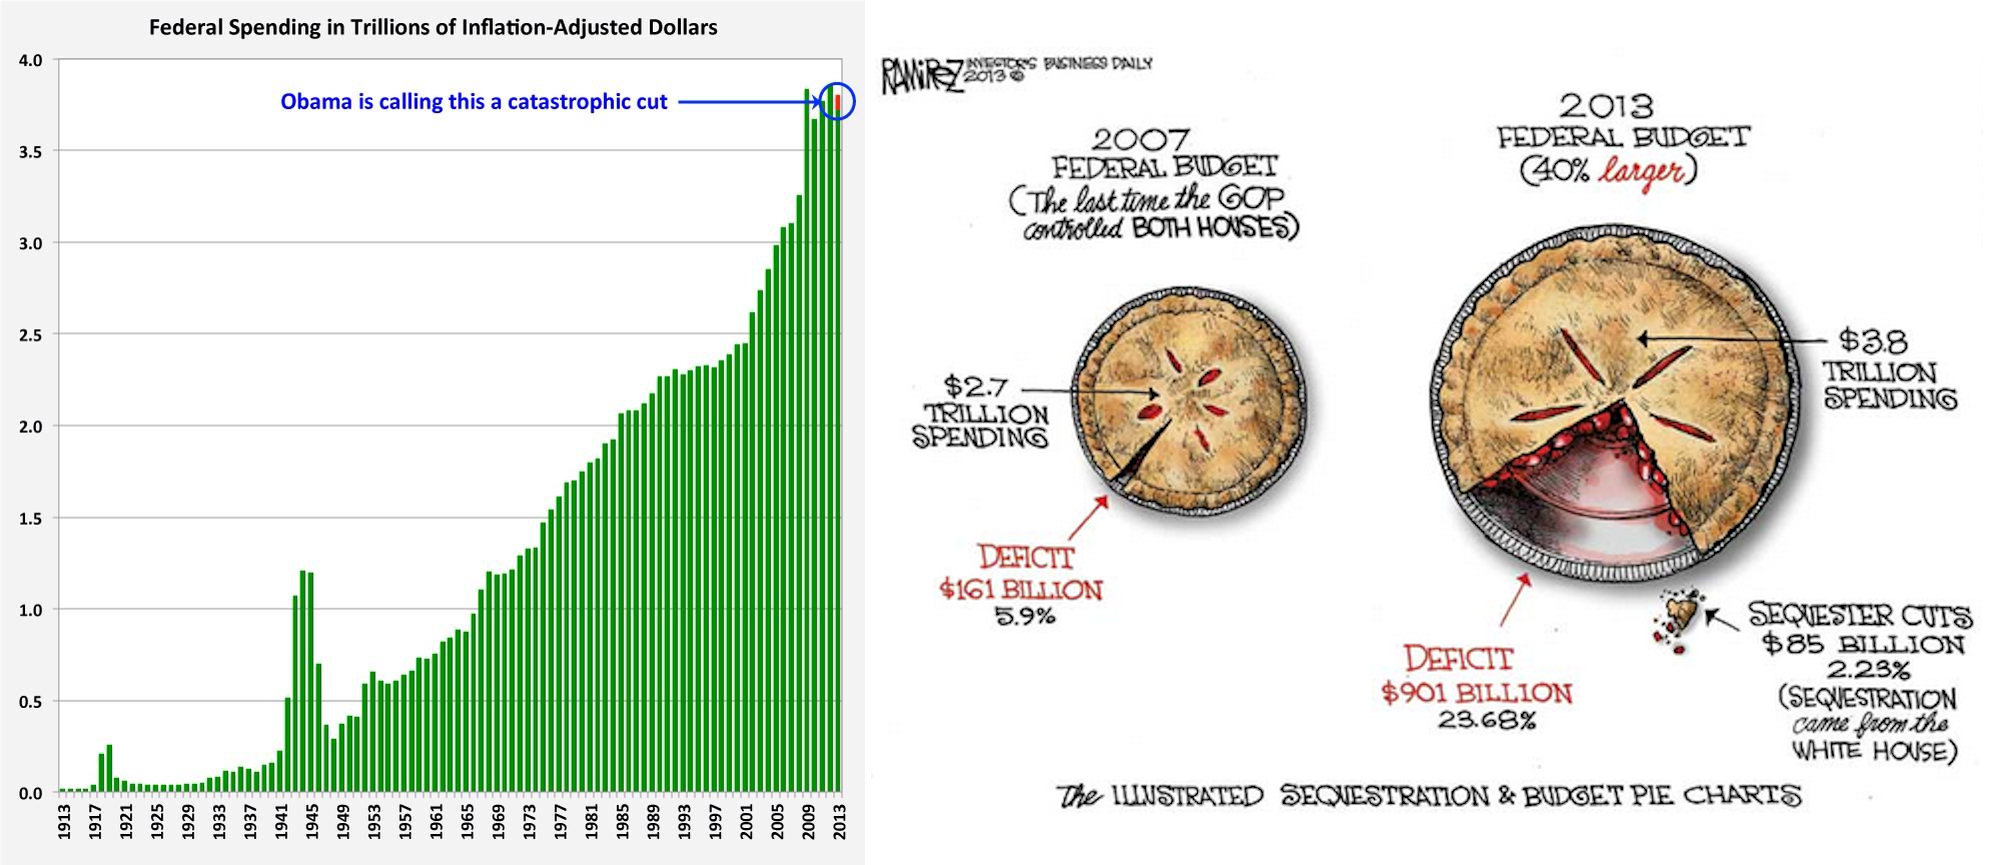

The sequestration cuts aren’t even cuts. They are just reductions in the increases in budgets.
If it’s not a glutten free crust with fare trade, organic fruit from within a 30 mile radius leftards won’t “get” the pie graph or give a crap as long as they get their piece.
I agree with the sentiment, but if you’re (as the author of the “pie chart”) going to pretend to do something for the “math is hard” crowd, then don’t detract from your point by getting the size of the figures completely wrong. The larger pie is 125% larger (that is, 2.25x the size) of the smaller pie. That is a far cry from the 40% figure stated directly above the image.
I guess “pie charts are hard” too.
It’s a very racist thing to say, but I don’t think 1/2 of Obama’s voters are gona understand that graph, let alone the Pie Chart, ;- )
The GOP is gona have to learn how to submit 10 Million Absentee Ballots that way we can at least start out even on Election Day.
Roy Green had a guest on last weekend that was from higher ed. He indicated that there are high school graduates going into colleges/universities that can’t read, write or perform basic math at an elementary level. This morning, I was in Tim’s buying a 1.40 small coffee, I gave the teen 2.40 and got .95 change. I said to her, I gave you 2.40, she replied “I thought you gave me 2.45”. These are all new NDP/Liberal voters.
“Americans have the RIGHT to be stupid” John Kerry
http://www.huffingtonpost.com/2013/02/26/john-kerry-right-to-be-stupid_n_2764973.html?utm_hp_ref=canada&ir=Canada
No worries.
Couple of spoonfuls of Hopey Changey administered by King BamBam the First, the world’s greatest Economist and all will be well.
The federal spending chart needs to be normalized to GDP or population or some other pertinent metric otherwise it is misleading. That said, the overall point is correct.
The Republicans need to start standing up to Obama. Enough of the cowardice. Like a spoilt child, Obama will go crazy if he cannot get what he wants and hopefully he will then self-implode along with all the utter cronies he has surrounded himself with.
I think I will continue to buy precious metals.
That would be brass, lead, and blued steel.
The Republicans are the flip side of the same coin. There is NO difference between the two parties at this time in history.
The US is a “feel good” political system, unable to look the electorate in the eyes and say “no” to the big spending and big borrowing and bowing to the Banksta’s.
Keynesian economics is the only thing taught by the higher halls of learnin’, implementing the fractional banking system and deficit economics theories like there are no alternatives.
In order to communicate with somebody, you have to be able to speak in a language which can be understood by both parties, especially the learner. Tax and spend is the language of the leftards, and now being adopted by the right, and conservative thought is becoming a lost dialect.
Best get used to feeding the pablum to the yute, cause that’s all they have an appetite for.
So, do I still get my free phone or not?
I have no problem with charts or pie charts or even pie. If this graphic helps the American electorate understand their disastrous decision this past November and why they are, in effect, Greece and soon Zimbabwe, then all is good.