Why this blog?
Until this moment I have been forced to listen while media and politicians alike have told me "what Canadians think". In all that time they never once asked.
This is just the voice of an ordinary Canadian yelling back at the radio -
"You don't speak for me."
email Kate
Goes to a private
mailserver in Europe.
I can't answer or use every tip, but all are appreciated!


Katewerk Art
Support SDA
Paypal:
Etransfers:
katewerk(at)sasktel.net
Not a registered charity.
I cannot issue tax receipts
Favourites/Resources
Instapundit
The Federalist
Powerline Blog
Babylon Bee
American Thinker
Legal Insurrection
Mark Steyn
American Greatness
Google Newspaper Archive
Pipeline Online
David Thompson
Podcasts
Steve Bannon's War Room
Scott Adams
Dark Horse
Michael Malice
Timcast
@Social
@Andy Ngo
@Cernovich
@Jack Posobeic
@IanMilesCheong
@AlinaChan
@YuriDeigin
@GlenGreenwald
@MattTaibbi
Support Our Advertisers

Sweetwater

Don't Run

Polar Bear Evolution

Email the Author
Wind Rain Temp
Seismic Map
What They Say About SDA
"Smalldeadanimals doesn't speak for the people of Saskatchewan" - Former Sask Premier Lorne Calvert
"I got so much traffic after your post my web host asked me to buy a larger traffic allowance." - Dr.Ross McKitrick
Holy hell, woman. When you send someone traffic, you send someone TRAFFIC.My hosting provider thought I was being DDoSed. - Sean McCormick
"The New York Times link to me yesterday [...] generated one-fifth of the traffic I normally get from a link from Small Dead Animals." - Kathy Shaidle
"You may be a nasty right winger, but you're not nasty all the time!" - Warren Kinsella
"Go back to collecting your welfare livelihood." - Michael E. Zilkowsky
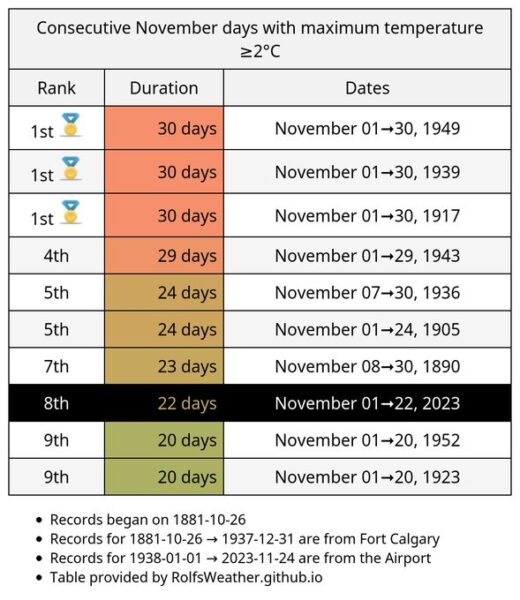

The last time things were this warm was 71 years ago? Mein Gott! Save us from the global cooling!
That inconvenience has been smoothed out in the official temperature graph.
This site here: https://www.weatherstats.ca/ has a whole pile of such info. If you click on Calgary, for instance, it will give you current weather. In the top toolbar, click on “Charts.” Then scroll down and on the line for “Number of days >30C, select the second to last column, Annual Data, and get the chart, which will only show the last few years. Click on 6X in the toolbar and see the record far back to before the readings were recorded. Put the cursor over the tallest line. 1936 had 23 days over 30°C, a record that has never been exceeded. Seems to me that it should have been eclipsed by now if global warming was a real thing. There is no warming trend there at all.
Exactly! That was the “dirty 30’s”, when many western Canadian farms had no rain and people became insolvent with no crops and not even good grazing for cattle.
In the Dirty Thirties, many people in Southern Alberta organised picnic and ball tournaments for Christmas Day. Warm weather during the “winter” months (November to March) IS NOT unusual.
Also from Stats Canada https://climate.weather.gc.ca/climate_normals/results_1981_2010_e.html?stnID=2205&autofwd=1
Extreme Max still July 15 1919
You can search anywhere in Canada here
Looks like a little adjusting to correct the temperature to fit the narrative.
https://climate.weather.gc.ca/historical_data/search_historic_data_stations_e.html?searchType=stnName&timeframe=1&txtStationName=Ottawa&searchMethod=contains&optLimit=yearRange&StartYear=1840&EndYear=2023&Year=2023&Month=11&Day=28&selRowPerPage=25
The only on in my lifetime is this year, and I was born when Diefenbaker was PM and Eisenhower was POTUS.
So the warm 2023 Nov is good for two slots on the chart,,, 20 days in a row, and 22 days!!!
I suppose if they were to add the 21 day stretch as well, then it would be too obvious.
The 20 days is 1923, not 2023.
indeed, sorry about that.
Well, I was born and grew up in Calgary, daughter of two Albertans and grandparents born there too, as were my siblings in the post-war era. I speak with them often, and weather is a topic.
Calgary is, on average, a bit warmer than it was when I was a kid. Kids who grew up in the 1950s did not notice crap weather if they had good snowsuits. That said, I do not go to Calgary for Canadian Thanksgiving (Oct. 10 or so), as the last time I did, the snow came and stayed.
We used to say: there are two Calgary seasons: Stampede week and winter, which begins mid-August. Snow can fall in July some years, but the amazing Chinooks, sun and people I know make the territory livable. Not sure about newer folks.
Yes, this site may have cooked the books, as today Calgary and Vancouver both have matching cold weather. It is hard to sell global warming during Canadian winters, as it is fake.
5 of the top 7 streaks go to November 30. Did they continue into December????????
Where did 6th place go?
Tie for 5th/6th
One of the “features” of big data surfing is you can specify search constraints and then look at the “results”.
If the results don’t support your thesis, alter the search criteria. Eventually you’ll find something you can use.
For example; pick temps of 4, 3, 2,1,0 etc.
And then is it daily average, daytime high, daytime low, etc.
Eventually you’ll find a cherry to present to the media/public.
Good for you, Joe. Lying with statistics is easy, unless they are caught out.
I did days below 0C, days below -20C, days with rain, and days with snow. From that, I would posit that Calgary may be somewhat warmer than it was when Calgary was new, but it’s also snowier and wetter. By very, very small margins.
Modern temperatures have been taken from … the airport? Anthony Watts did a comprehensive review of all the weather stations placed under direct influence of the UHI (Urban Heat Island) effect. I would suggest that the Sask. airport is a much warmer locale what with all the hard, dark, pavement and jet engine exhaust than any other weather station in Sask.
Unfortunately, have to use the somewhat problematic Wayback Machine, but:
https://web.archive.org/web/20231106212059/https://www.numberwatch.co.uk/number%20watch.htm
Much like John Daly (not the golfer, but I’d trust his take on climate before a climate scientist), I miss this guy.
There are so many temperature measurements being taken that there are several records being broken every week. You simply have to cherry pick out the ones you want to create “global boiling”.
You can also use the trick “it’s not what you say, it’s what you don’t say”, such as when it was headline news that that week 1500 high temperature records had been broken (US only), and there was complete silence when a few weeks later there were 3000 low temperature records broken.
“There’s lies, damn lies, and statistics”.
Anther blast from the past is the temperature record from May 29 1934 where it was 100F or 37C for several days on the prairies. Important enough that it got reported in Australia.
https://trove.nla.gov.au/newspaper/article/41501705
June 21, 2023, longest day of the year, official start to the summer, Calgary Alberta.
It SNOWED that week, IN Calgary. If not for the furnace being turned back on, we were freezing in the basement while visiting relatives………
Was looking at the record high temperatures for Winnipeg for each day in December. Most of them occurred in the nineteenth century. The second most frequent period was the 1930s.
I’m not sure if anyone else has been keeping track; but I have been doing my own “research” with regards to these weather reports about the “highest average” temperatures ever recorded…etc..etc…
Here is what I found. And what you should check out. I’m in Southern Ontario. And for a good portion of this summer, the weather “experts” were reporting temperatures as I will show below; followed by my own observations. Clearly the weather folks hope people aren’t paying attention. But I am a bit of a stickler for detail. Check it yourself and see what I mean. Here is what I found to be happening.
Temperature Reported: 34 degrees C.
Actual Temperature according to my thermometer: 28 degrees
Temperature Reported: 32 degrees C.
Actual Temperature according to my thermometer: 28 degrees
Temperature Reported: 29 degrees C.
Actual temperature according to my thermometer: 27 Degrees. C
And this goes on almost daily. Now you don’t ‘have to be a math genius to figure out that an average temperature (or average anything) is going to appear to be higher…….if the person making the calculation is increasing the actual temperature by about 4 to 6 degrees each day.
One would have to ask…..why are they trying to make it look hotter than it actually is?
Perhaps some political narrative they are trying to sell?
Or maybe I’m just paranoid.
But try it yourself. See if you get the same results.
And I’m pretty sure this is going on all over the world. At least in the “woke” countries.