Why this blog?
Until this moment I have been forced to listen while media and politicians alike have told me "what Canadians think". In all that time they never once asked.
This is just the voice of an ordinary Canadian yelling back at the radio -
"You don't speak for me."
email Kate
Goes to a private
mailserver in Europe.
I can't answer or use every tip, but all are appreciated!


Katewerk Art
Support SDA
Paypal:
Etransfers:
katewerk(at)sasktel.net
Not a registered charity.
I cannot issue tax receipts
Favourites/Resources
Instapundit
The Federalist
Powerline Blog
Babylon Bee
American Thinker
Legal Insurrection
Mark Steyn
American Greatness
Google Newspaper Archive
Pipeline Online
David Thompson
Podcasts
Steve Bannon's War Room
Scott Adams
Dark Horse
Michael Malice
Timcast
@Social
@Andy Ngo
@Cernovich
@Jack Posobeic
@IanMilesCheong
@AlinaChan
@YuriDeigin
@GlenGreenwald
@MattTaibbi
Support Our Advertisers

Sweetwater

Don't Run

Polar Bear Evolution

Email the Author
Wind Rain Temp
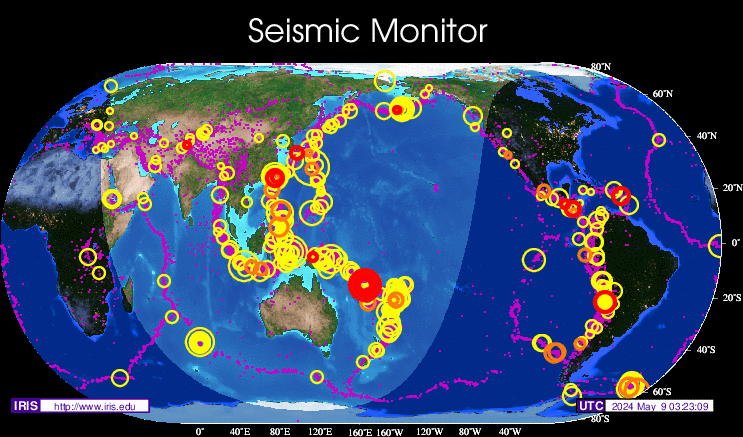
Seismic Map
What They Say About SDA
"Smalldeadanimals doesn't speak for the people of Saskatchewan" - Former Sask Premier Lorne Calvert
"I got so much traffic after your post my web host asked me to buy a larger traffic allowance." - Dr.Ross McKitrick
Holy hell, woman. When you send someone traffic, you send someone TRAFFIC.My hosting provider thought I was being DDoSed. - Sean McCormick
"The New York Times link to me yesterday [...] generated one-fifth of the traffic I normally get from a link from Small Dead Animals." - Kathy Shaidle
"You may be a nasty right winger, but you're not nasty all the time!" - Warren Kinsella
"Go back to collecting your welfare livelihood." - Michael E. Zilkowsky

Very high quality web-site and an excellent post. Two things that stand out to me:
1. From Figure 5 (Stacked US total rig count), rig total was cut in half in 2015 with most of the drop coming from gas plays. But for the 10 preceding years gas drilling was very high. This suggests a massive over-supply of gas in the US.
2. From Figure 15 (OPEC spare capacity), OPEC has lost its ability to cut back production even when faced with sustained low oil prices. The only country showing any restraint is Saudi Arabia.
These 2 graphs alone suggest continuing low oil & gas prices due to over supply.
Get to de charging station…..
http://www.cbc.ca/news/business/volvo-hybrid-electric-2019-1.4190649
And thank you Volvo for taking your drivers off the highways!
Well of course, all that means is Peak Oil will get here that much sooner!!! Shocked and appalled!!
I didn’t know Volvo was now a Chinese owned company!
So much for the snotty attitude I’ve encountered from Volvo owners over the years,the “superior” look given to those of us who drive American or Asian vehicles.
AC … haha ha ha … EXACTLY! thank you Volvo for keeping the highways safer by getting your “safety-obsessed” driver’s out of the left lane at 55mph.
grok … I pledge to do my part in helping accelerate the achievement of Peak Oil … esp. if OPEC helps keep the price low by over-producing beyond the market needs.
The documented mass transition from drilling shale gas to drilling shale oil is a slippery fish. All shale gas wells produce some liquids and vice versa. So while it may seem a miracle that the US has kept gas production going with under 200 rigs, we need to remember that 750 rigs drilling oil are also producing gas.
You need to look at the absence of drilling every where else apart from N America and M East. This will eventually show up as a new round of oil scarcity with a new price spike beginning 2019 is my best guess.