The plot above replaces an earlier sea ice extent plot, that was based on data with the coastal zones masked out. This coastal mask implied that the previous sea ice extent estimates were underestimated. The new plot displays absolute sea ice extent estimates. The old plot can still be viewed here for a while.
I’m a connoisseur of these kind of graphs. I’ve seen many presentations by different groups.
This: http://nsidc.org/arcticseaicenews/charctic-interactive-sea-ice-graph/
is by far the best. First, the graph is big. Second, on the NSIDC site one can see any single year you choose from 1979 to present or select some years while excluding others or see all years. And third, you can enlarge an area you select to get a close up view….very helpful. And fourth both poles are available. And fifth, you can actually “see” the ice extent pictorially, although this site: http://ocean.dmi.dk/arctic/icedrift_anim/index.uk.php
is better for “seeing” the CHANGES in actic ice extent. Like the first one, it is also interactive.
I visit both site regularly.
*note: There are 2 slightly different definitions of ice extent. Some graphs show one, some the other. 15% ice coverage is the most common definition.
Sorry, got carried away and forgot to make my point. Yes, the ice extent has recovered in comparison to some of the other recent years, not so much in comparison to others in the 80s and 90s. I guess that’s the point of showing the graph…. predicted “catastrophic” summer melting has not occurred.
However, I’m not sure what meaning ANY of it has as there are only 35 data points in total. In my view, that is not a sufficient number to draw conclusions from. The freezing in the Arctic is variable. Last year’s freeze in the Chukchi sea (near Alaska) was different (faster) than this year’s freeze which is much earlier in the Kara sea (near Russia) than last year.
In any case, ask me again 15 years ….. that is unless the doom sayers predictions come true and ALL of the ice melts in the summer of 2020 (seems pretty unlikely).
David,
Agreed.
When the Antarctic record was being set one could follow progress clearly every day to see where it peaked – fun!
The early 80s were when the scientists were preaching global cooling , new ice-age including Carl (wave like flag) Sagan , warm / cold / warm on 22 year cycles. I’ll take sunspots for a win Alex
I want to see the real graphs from 50 thousand years ago.
The reason we still have ice at the poles is that we are still coming out of the last ice age…not that tough of a concept. We are still on average 6 degrees c colder than the average temp of the earth over the last 1 billion years and about 2000 PPM co2 less than on average for the last billion years. 22,000 years ago the artic sea ice was 1.5 miles deep in Chicago. We have no control but those who must control will keep pushing the climate crap weather they believe or not Control is an addiction. Just try taking their control of events away and see what happens….does Ferguson ring a bell?
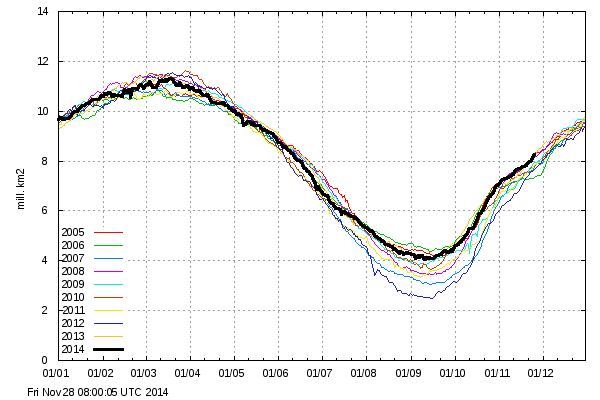

This is an old plot (it’s even in the filename: old_icecover.uk.php). There’s another chart, at http://ocean.dmi.dk/arctic/icecover.uk.php, which replaces this plot.
the recovery of the ice
is further proof of AGW
Link fixed: http://ocean.dmi.dk/arctic/icecover.uk.php
Personally, I prefer this link… http://arctic.atmos.uiuc.edu/cryosphere/arctic.sea.ice.interactive.html
This one is pretty good too….
http://arctic.atmos.uiuc.edu/cryosphere/iphone/images/iphone.anomaly.global.png
This one shows the decadal averages —
http://www.ijis.iarc.uaf.edu/en/home/seaice_extent.htm
And it’s always interesting to check in at the other pole, because
whadya’ know, it has ice too…..
http://arctic.atmos.uiuc.edu/cryosphere/IMAGES/seaice.anomaly.antarctic.png
The big rink they call the Arctic Ser-Kul.
But it’s “new” ice.
I’m a connoisseur of these kind of graphs. I’ve seen many presentations by different groups.
This:
http://nsidc.org/arcticseaicenews/charctic-interactive-sea-ice-graph/
is by far the best. First, the graph is big. Second, on the NSIDC site one can see any single year you choose from 1979 to present or select some years while excluding others or see all years. And third, you can enlarge an area you select to get a close up view….very helpful. And fourth both poles are available. And fifth, you can actually “see” the ice extent pictorially, although this site:
http://ocean.dmi.dk/arctic/icedrift_anim/index.uk.php
is better for “seeing” the CHANGES in actic ice extent. Like the first one, it is also interactive.
I visit both site regularly.
*note: There are 2 slightly different definitions of ice extent. Some graphs show one, some the other. 15% ice coverage is the most common definition.
Sorry, got carried away and forgot to make my point. Yes, the ice extent has recovered in comparison to some of the other recent years, not so much in comparison to others in the 80s and 90s. I guess that’s the point of showing the graph…. predicted “catastrophic” summer melting has not occurred.
However, I’m not sure what meaning ANY of it has as there are only 35 data points in total. In my view, that is not a sufficient number to draw conclusions from. The freezing in the Arctic is variable. Last year’s freeze in the Chukchi sea (near Alaska) was different (faster) than this year’s freeze which is much earlier in the Kara sea (near Russia) than last year.
In any case, ask me again 15 years ….. that is unless the doom sayers predictions come true and ALL of the ice melts in the summer of 2020 (seems pretty unlikely).
David,
Agreed.
When the Antarctic record was being set one could follow progress clearly every day to see where it peaked – fun!
The early 80s were when the scientists were preaching global cooling , new ice-age including Carl (wave like flag) Sagan , warm / cold / warm on 22 year cycles. I’ll take sunspots for a win Alex
I want to see the real graphs from 50 thousand years ago.
The reason we still have ice at the poles is that we are still coming out of the last ice age…not that tough of a concept. We are still on average 6 degrees c colder than the average temp of the earth over the last 1 billion years and about 2000 PPM co2 less than on average for the last billion years. 22,000 years ago the artic sea ice was 1.5 miles deep in Chicago. We have no control but those who must control will keep pushing the climate crap weather they believe or not Control is an addiction. Just try taking their control of events away and see what happens….does Ferguson ring a bell?