Why this blog?
Until this moment I have been forced to listen while media and politicians alike have told me "what Canadians think". In all that time they never once asked.
This is just the voice of an ordinary Canadian yelling back at the radio -
"You don't speak for me."
email Kate
Goes to a private
mailserver in Europe.
I can't answer or use every tip, but all are appreciated!


Katewerk Art
Support SDA
Paypal:
Etransfers:
katewerk(at)sasktel.net
Not a registered charity.
I cannot issue tax receipts
Favourites/Resources
Instapundit
The Federalist
Powerline Blog
Babylon Bee
American Thinker
Legal Insurrection
Mark Steyn
American Greatness
Google Newspaper Archive
Pipeline Online
David Thompson
Podcasts
Steve Bannon's War Room
Scott Adams
Dark Horse
Michael Malice
Timcast
@Social
@Andy Ngo
@Cernovich
@Jack Posobeic
@IanMilesCheong
@AlinaChan
@YuriDeigin
@GlenGreenwald
@MattTaibbi
Support Our Advertisers

Sweetwater

Don't Run

Polar Bear Evolution

Email the Author
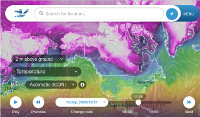
Wind Rain Temp
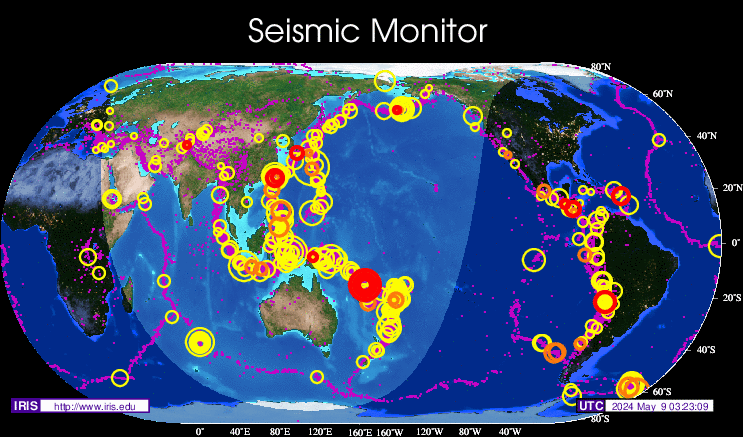
Seismic Map
What They Say About SDA
"Smalldeadanimals doesn't speak for the people of Saskatchewan" - Former Sask Premier Lorne Calvert
"I got so much traffic after your post my web host asked me to buy a larger traffic allowance." - Dr.Ross McKitrick
Holy hell, woman. When you send someone traffic, you send someone TRAFFIC.My hosting provider thought I was being DDoSed. - Sean McCormick
"The New York Times link to me yesterday [...] generated one-fifth of the traffic I normally get from a link from Small Dead Animals." - Kathy Shaidle
"You may be a nasty right winger, but you're not nasty all the time!" - Warren Kinsella
"Go back to collecting your welfare livelihood." - Michael E. Zilkowsky


This is why NASA hasn’t put up a dedicated Earth temperature sat. Because they knew it would blow the whole ballgame.
I could be wrong, but I do recall reading someplace that satellite temperature measurements are currently done by inference from multiple instruments that weren’t specifically made to do that job. There’s a reason for that, and this flat temperature record is the reason.
But there HAS been global warming for 49.6% of the global record!!
If I squint real hard, what I see is approximately one cycle of a rather ragged sine curve. If true, that suggests we are in for about 20 years of cooler weather.
Looks like we’re about to take the plunge again. The ’70s had killer blizzards in Northern New York, I think 7 or 8 people froze to death in stranded cars around Buffalo NY in one. Our farm near the 1000 Islands area received dumps of 2 or 3 feet every winter, it would take all day before we saw the first plow go by.
Looks like it is time to invest in a snowmobile, a heavy duty backup generator and a supply of e-books.
But, but, but according to the warmers we’re supposed to be getting warmer… but, but, but we’re not. Understand?
What does your (other) brother daryl say?
But there HAS been global warming for 49.6% of the global record!!
Try reading the chart. From the first recordings to 1998 the temperature was below the zero point indicated. In 1998 the El Nino caused the increase to the new baseline.
Of course, this ignores the “global cooling” that was gong to doom us and took place (allegedly) prior to the start of the satellite record, so any “global warming” was just resetting to the zero point indicated, not that there is any “correct” temperature the planet is supposed to be.
It also ignores the fact that of the CO2 in the atmosphere, 96% is natural, which means that only about 14 PPM are “man made” (as if humans are not “natural”), which further means that any “man made” addition to atmospheric CO2 will jave bupkis of an effect on climate.
Southern Saskatchewan received snow almost all day yesterday, we’re still anxiously waiting for some of that global warming that we’ve all been promised. We’re now in our 7th straight month of winter. Maybe the problem here is that our air is too clean or is it that the full of hot air AGW blowharts just stay away from us.
Want to see just how stupid global warming really is?…
Don’t look at those exaggerated graphs….plot it on a red line alcohol thermometer
http://suyts.wordpress.com/2013/02/22/how-the-earths-temperature-looks-on-a-mercury-thermometer/
On a serious note, I’d like to see that mapped against solar activity to see if there is a correlation. On a humorous note, I’d like to see tree-ring data being used instead. Ok, no I wouldn’t….. wait, cow-fart data, yeah, that’s what I’d like to see, for a possible correlation.
“as if humans are not natural”
Hear Hear. I claim to be a natural resident of this planet ever bit as much as any polar bear.
could we now have the polar bear’s opinion??
Me too. Just higher up on the food chain than frickin’ bears, thanks to the good ol’ oposable thumb and Mr. Mauser’s excellent repeating rifle.
Woof, F’n Woooof!!
The Oceans absorb about 93% of the solar energy hitting the earth. The graphs show there has been no let up in global warming, with oceans continuing to warm.
http://2.bp.blogspot.com/-xWDsXtdIsZ8/Ut6n_xnDMgI/AAAAAAAADaU/2acg-PJjL8U/s1600/20140121-OHC-4Q-2013_0-700m.png
Excess energy is absorbed in the oceans, that’s how the planet regulates the temperature. Human activities have little or no effect on this.
Yeah well, they musta pulled that data outa their lower tract.
The Argos buoys have reported a net cooling of the oceans at all depths.
http://www.aoml.noaa.gov/phod/dac/dacdata.php