Why this blog?
Until this moment I have been forced to listen while media and politicians alike have told me "what Canadians think". In all that time they never once asked.
This is just the voice of an ordinary Canadian yelling back at the radio -
"You don't speak for me."
email Kate
Goes to a private
mailserver in Europe.
I can't answer or use every tip, but all are appreciated!


Katewerk Art
Support SDA
Paypal:
Etransfers:
katewerk(at)sasktel.net
Not a registered charity.
I cannot issue tax receipts
Favourites/Resources
Instapundit
The Federalist
Powerline Blog
Babylon Bee
American Thinker
Legal Insurrection
Mark Steyn
American Greatness
Google Newspaper Archive
Pipeline Online
David Thompson
Podcasts
Steve Bannon's War Room
Scott Adams
Dark Horse
Michael Malice
Timcast
@Social
@Andy Ngo
@Cernovich
@Jack Posobeic
@IanMilesCheong
@AlinaChan
@YuriDeigin
@GlenGreenwald
@MattTaibbi
Support Our Advertisers

Sweetwater
Don't Run

Polar Bear Evolution

Email the Author
Wind Rain Temp

Seismic Map
What They Say About SDA
"Smalldeadanimals doesn't speak for the people of Saskatchewan" - Former Sask Premier Lorne Calvert
"I got so much traffic after your post my web host asked me to buy a larger traffic allowance." - Dr.Ross McKitrick
Holy hell, woman. When you send someone traffic, you send someone TRAFFIC.My hosting provider thought I was being DDoSed. - Sean McCormick
"The New York Times link to me yesterday [...] generated one-fifth of the traffic I normally get from a link from Small Dead Animals." - Kathy Shaidle
"You may be a nasty right winger, but you're not nasty all the time!" - Warren Kinsella
"Go back to collecting your welfare livelihood." - Michael E. Zilkowsky
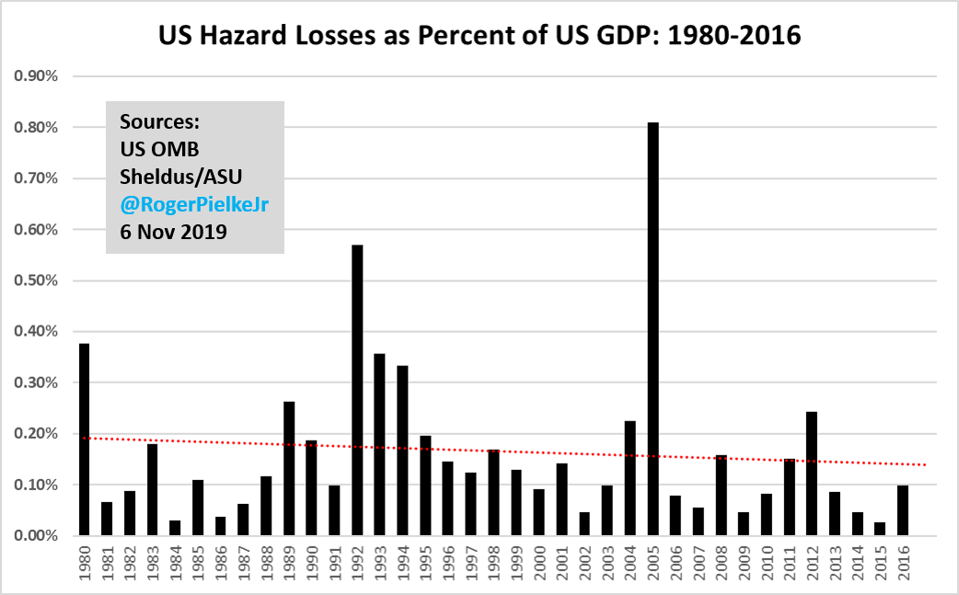

Gee, the media is lying with charts? Never seen that before. ~:D
Quite right, Phantom. In fact take away Katrina in 2005 (heavily added to from corruption and mismanagement in the Governor’s office and New Orleans Mayor’s office) and the trend line down becomes even more severe.
Where are years 2017 & 2018 on that graph?
Insufficient data for a trend line
There is plenty of data for a trend line. You obviously don’t know much about statistics, do you? Maybe take the time to educate yourself on what is going on here…..https://www.forbes.com/sites/rogerpielke/2019/11/07/everything-you-hear-about-billion-dollar-disasters-is-wrong/#56e629222fea
Gosh Joey, thanks for putting me in my place with some actual reasons for your position. Snort. Cough.
Show me the data and don’t change the subject.
Notwithstanding your rather childish response, the trend line is perfectly valid for the data set. If you knew anything about regression analysis, you would know that to pull that regression line to an upward trend would be almost impossible with an additional two years of data. And if you took the time to do some research yourself, you would probably find that the years after 2016 would not move that regression line. Grow up. When you are proven wrong, you need to man up.
36 years is plenty of data for a trend line, a couple more years wouldn’t change much. I would guess 2017 and 2018 weren’t included because at the time the original graph was made, those year’s data wasn’t yet available.
CaptainDan, perhaps they are with 1978 and 1979. I’m not a statistician, but I know enough to know if I didn’t collect the data myself and do the analysis myself, I must either rely on someone whose work I am not qualified to verify, or trust nobody.
So, how much more data would be sufficient for a trend line? Dig back to the 1960s? 1860s? Wait for 2029’s results?
The trend line is bogus. There is no trend. If you had to interpret that graph you would say there is no trend, just many years of low relative damage interrupted by a few years of high relative damage. Interesting that the few years are single years.
If you took only the outliers (1980, 1992, 2005) you would see an upward trend. This would allow you to say that while there is no real trend in the data when there are major hazard losses they have tended to increase in loss value. The reason for this should be fairly obvious. We have a lot more infrastructure in place and the infrastructure is much more expensive to replace.
Also, the outliers seem to occur once every 12-13 years. We would need the graph to extend out to 2020 or so to see the next major hazard loss.
But no trend. This means that the global climate holocaust is not affecting hazard losses, otherwise hazard losses would increase year over year AND/OR the time period that the major hazard losses occur would decrease (say from once every 10 years to once every 7-8 years).
CaptainDan, 36 years isn’t enough? Oh I know, it’s enough when you get the answer you want. Got it. See, here is the thing. We are smarter than you think you are.
My oh my, such protests about missing data.
First, the date on the graph is 11/6/2019. Why shouldn’t data from 2017 and 2018 be included? Enough time has passed for it to be available. Don’t you even wonder why it’s not included?
Second, 2017 had 2 hurricanes (Harvey in TX, Irma in FL) resulting in BILLIONS in damages not to mention wildfires in CA, OR,WA,ID and tornadoes, and,yes, a major winter storm in January.
I’m not going to review 2018. Do it your self.
Show me the data which supports a downward trend. That’s it, nothing more.
Hazard losses in the USA
2016: $154 billion
2017: $78 billion
2018: $52 billion
From the Insurance Information Institute.
https://www.iii.org/fact-statistic/facts-statistics-us-catastrophes
Come on Robert….THINK! The graph is all about a downward trend. Recent years are the basis for the argument…..though I’m fine if you want to move back the starting point as well…but not in place of recent years.
Talk to Joey. He doesn’t get it either.
USDA says one thing because the crop losses are staggering. Yet the Governors of the individual states are starting to demand Disaster Relief. I put my money on the State Governors. Globally the crop losses in the world’s great bread baskets is staggering. And that is in both Hemispheres. The 4th Horseman approaches with a grin. Beware the 1.4 B citizens of China when they get hungry. No more Sweet and Sour Pork, No more Chickee Ball. China just lost over 200M breeding sows and food inflation in China is going through the roof. This is how Empires fall. Read History. Prepare and ignore the Gubmint. The Elite always eat. Even in a famine.
“… The Elite always eat. Even in a famine.”
That’s what makes them such good eatin’. Especially in a famine. Invest in precious metals like copper, lead, blued steel, keep your power dry, your skills tuned, and keep a low profile.
Further, the USG subsidizes losses with national flood insurance. That this even still exists and isn’t being targeted for elimination shows how serious the eco-pols are (not very).
“Before proceeding, it is important to underscore that climate change resulting from the emission of greenhouse gases from the burning of fossil fuels poses significant risks to our collective futures, including influences on extreme events.”
That’s as far as I got…
Yes and that is why famines are coming globally because governments are not preparing for a cold sun and crop losses. The Degree Growing Days, or solar output required to produce crops in a timely manner is not there. This has SFA to do with CO2. But that is the only mantra that the Trudeau’s and ThungBorgs can chant. They should be the first to decorate a light post when the hunger comes. Or harnessed to a plow on some war lords farm.
Damnit…BAG, ya beat me to it..!!
That statement completely obliterates anything else he said.
Kissing Eco-Fascism ass gets you nowhere – just ask Scheer.
And as always, lost in the discussion is the FACT that 2 of their top people stated way back in 2012-13 that Climate Change has SFA to do with the Climate / Environmen and everything to do with Destroying Western Hemisphere Capitalism.
“..changing the current world economic model of the past 150 yrs..”
Christina Figueres
Ottmar Edenhoffer
Typical BS Story. 1 among tens of thousands.
The global warmunists blame everything on CO2 emissions, and I agree, I almost stopped reading at that point. But the significance of this story is that it’s one of their own who is exposing the BS. I find that encouraging, maybe this newfound insight will make him examine the rest of the scam more closely.
I doubt it.
“Kissing Eco-Fascism ass gets you nowhere – just ask Scheer.”
Bernier must have kissed a shit-ton of it because Scheer has a seat in parliament and Bernier is NOWHERE to be found. snork
Me too!
Think about it this way. The authors can’t write “if we don’t mention climate change we won’t get this graph published”. It’s baked into the cake so read on knowing that. There are many scientists hiding excellent research in plain sight.
Just because you can draw a line through it doesn’t mean that it’s statistically meaningful. In any event the ‘increased losses due to changed climate’ line is debunked.
“Before proceeding, it is important to underscore that climate change resulting from the emission of greenhouse gases from the burning of fossil fuels poses significant risks to our collective futures,…”
I always just stop reading when I come to a line like that. An article written by my enemy, is not useful to me.
“An article written by my enemy, is not useful to me.”
https://www.youtube.com/watch?v=dObTXYa-_n4
And let me add that the “natural disasters” of FIRE in CA are anything BUT natural. These fires have been STARTED by a decaying PG&E, Eco Terrorists, and Homeless encampments. These FIRES have been worsened by an ignorant forestry policy of hands-off “natural management”. So, in my humble opinion … nearly ALL of the WORST CA Fires should be removed from any list of “natural” disasters. They’re NOT natural. Yet they’ve COST $T’s
Food Hyperinflation Hitting China. Hey who cares if 1.4B Chinese are hungry. Bring back Chairman Mao. The new Fascism is just like the Old Fascism only now the face is Greta and the Goddess Gaia. Blame CO2 Bring on the Tax On The Stupid. Somehow this will become another AWG tale of Carbon Terrorism.
https://www.zerohedge.com/economics/pork-hyperinflation-sends-chinese-consumer-prices-soaring-most-7-years
And Justin will happily sell the bastards all the pork they want.
A man would have told them that if the Han want meat, they are free to slaughter each other. China was overdue for one of the famines that used to keep its population to a sustainable level.
Sweet and sour Communist swine, anyone?
One of my kids is on a 3-week trip to Japan and Taiwan. Let me say that everywhere they’ve gone, there’s LOTS of meat being eaten. Everything imaginable (all gorgeously prepared, BTW). Lots of pork. The WHOLE pig, including the squeal! BBQ’ed, skewered, in soups, in noodles … pork everywhere
Those famines used to do that. The Chinese are organised on a different scale now. If they gave every woman in the PLA* an old SKS and five days rations and put them on container ships to our west coast ports, our armed forces couldn’t put them out.
*Official strength 2.3million personnel, estimated 7.3% female.
The two worst years were due to hurricanes. I wonder if Americans have stopped building very expensive homes by the ocean.
I don’t want to sound like a callous arsehole, but aren’t disasters good for the economy? Houses get destroyed and cars flood ergo people need new houses and cars and appliances and things. Hotels get full while houses are built, rental cars get rented, people get employed. Win win win!
We are all callous arseholes but you make a great point. The funding for rebuilding comes primarily from the Federal government. It’s an easy way of putting money into the economy. And with low interest rates, plus the government buying us more and more with our own tax dollars we should expect the “cost” of rebuilding to always go up.
No. Creating wealth to spend on things and then spending more of it to replace those things before they are used up or worn out is not good economy.
The three outlier years are all hurricane years. 2005 as noted was Katrina, 1992 was Andrew hitting south Florida, and 1980 was probably in some part due to another cat-5 hurricane, Allen, hitting south Texas although I seem to recall it was a bad drought year in parts of the mid-South. Take those three out of the graph and you have no real trend at all.
Also two other minor peaks, 1989 (Hugo) and 2012 (Sandy) may be attributable to those storms hitting.
I wonder what 1900 looked like with a hurricane obliterating Galveston. I am guessing it would be a higher percentage of GDP at that point in time. 1926 and 1928 also had very costly hurricane strikes in south Florida.