Why this blog?
Until this moment I have been forced to listen while media and politicians alike have told me "what Canadians think". In all that time they never once asked.
This is just the voice of an ordinary Canadian yelling back at the radio -
"You don't speak for me."
email Kate
Goes to a private
mailserver in Europe.
I can't answer or use every tip, but all are appreciated!


Katewerk Art
Support SDA
Paypal:
Etransfers:
katewerk(at)sasktel.net
Not a registered charity.
I cannot issue tax receipts
Favourites/Resources
Instapundit
The Federalist
Powerline Blog
Babylon Bee
American Thinker
Legal Insurrection
Mark Steyn
American Greatness
Google Newspaper Archive
Pipeline Online
David Thompson
Podcasts
Steve Bannon's War Room
Scott Adams
Dark Horse
Michael Malice
Timcast
@Social
@Andy Ngo
@Cernovich
@Jack Posobeic
@IanMilesCheong
@AlinaChan
@YuriDeigin
@GlenGreenwald
@MattTaibbi
Support Our Advertisers

Sweetwater

Don't Run

Polar Bear Evolution

Email the Author
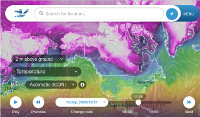
Wind Rain Temp
Seismic Map
What They Say About SDA
"Smalldeadanimals doesn't speak for the people of Saskatchewan" - Former Sask Premier Lorne Calvert
"I got so much traffic after your post my web host asked me to buy a larger traffic allowance." - Dr.Ross McKitrick
Holy hell, woman. When you send someone traffic, you send someone TRAFFIC.My hosting provider thought I was being DDoSed. - Sean McCormick
"The New York Times link to me yesterday [...] generated one-fifth of the traffic I normally get from a link from Small Dead Animals." - Kathy Shaidle
"You may be a nasty right winger, but you're not nasty all the time!" - Warren Kinsella
"Go back to collecting your welfare livelihood." - Michael E. Zilkowsky

Well, if that’s not Climate Change ….
The lack of hurricanes does not matter, as Ibola and the tilting of the earth’s axis is now the latest manifestation of Climate Disruption, aka Climate change, aka Global Warming, or what ever the latest Climate Scam buzzword is.
It’s the weather.
If it’s climate change then bring it on!
The problem with this chart, Kate, is that it was created from an actual count of the number of hurricanes. “Everyone knows” that you cannot simply use observed data to make proper scientific charts. As with temperature graphs, the data must be “improved” by applying various assumptions to create more “accurate” data sets. /s
Data sets that more accurately state what the “modeler” wants them to show.
The graph shows “9 year mean”…. whatever that is. Show me the actual counts. I perfectly capable of interpreting a simple chart of numbers by year. Why make it a statistical abstract?
No worries, the warmists will use 2014 as a new base year so future normal activity can be misconstrued as abnormal, thus demonstrating their AGW case.
Or,
If the warmists are really smart (which they’re not), they will see the pause in warming as an opportunity to get out from under their fraudulent, rent seeking activities by declaring they have cooled the earth with the largesse granted them. Unfortunately, though that keeps them out of jail it ends their pay parade – until the next climate crisis, of course.
It’d be pretty hard to hide that decline.
You beat me to it BJG. The data have to be “smoothed” and “adjusted”. Then you’ll see the massive increase in extreme weather events like “superstorms” (previously referred to as “hurricanes”) that absolutely proves global climate disruption warming collapse change . . . something or other.
That graph, or an unsmoothed original, is neither predicted nor predictable with current science.