Why this blog?
Until this moment I have been forced to listen while media and politicians alike have told me "what Canadians think". In all that time they never once asked.
This is just the voice of an ordinary Canadian yelling back at the radio -
"You don't speak for me."
email Kate
Goes to a private
mailserver in Europe.
I can't answer or use every tip, but all are appreciated!


Katewerk Art
Support SDA
Paypal:
Etransfers:
katewerk(at)sasktel.net
Not a registered charity.
I cannot issue tax receipts
Favourites/Resources
Instapundit
The Federalist
Powerline Blog
Babylon Bee
American Thinker
Legal Insurrection
Mark Steyn
American Greatness
Google Newspaper Archive
Pipeline Online
David Thompson
Podcasts
Steve Bannon's War Room
Scott Adams
Dark Horse
Michael Malice
Timcast
@Social
@Andy Ngo
@Cernovich
@Jack Posobeic
@IanMilesCheong
@AlinaChan
@YuriDeigin
@GlenGreenwald
@MattTaibbi
Support Our Advertisers

Sweetwater

Don't Run

Polar Bear Evolution

Email the Author
Wind Rain Temp
Seismic Map
What They Say About SDA
"Smalldeadanimals doesn't speak for the people of Saskatchewan" - Former Sask Premier Lorne Calvert
"I got so much traffic after your post my web host asked me to buy a larger traffic allowance." - Dr.Ross McKitrick
Holy hell, woman. When you send someone traffic, you send someone TRAFFIC.My hosting provider thought I was being DDoSed. - Sean McCormick
"The New York Times link to me yesterday [...] generated one-fifth of the traffic I normally get from a link from Small Dead Animals." - Kathy Shaidle
"You may be a nasty right winger, but you're not nasty all the time!" - Warren Kinsella
"Go back to collecting your welfare livelihood." - Michael E. Zilkowsky


Would I be correct in assuming that it has been extraordinarily warm over the last, say, 10,000 years?
So there was a cave man somewhere 10,000 years ago screaming at his other fellow cave dwellers “manbearpig come and kill everyone! Al Grog say no more debate! manbearpig real!”
hold that candle still Hezikiah whilst I lay down a base line. – Dennis Miller
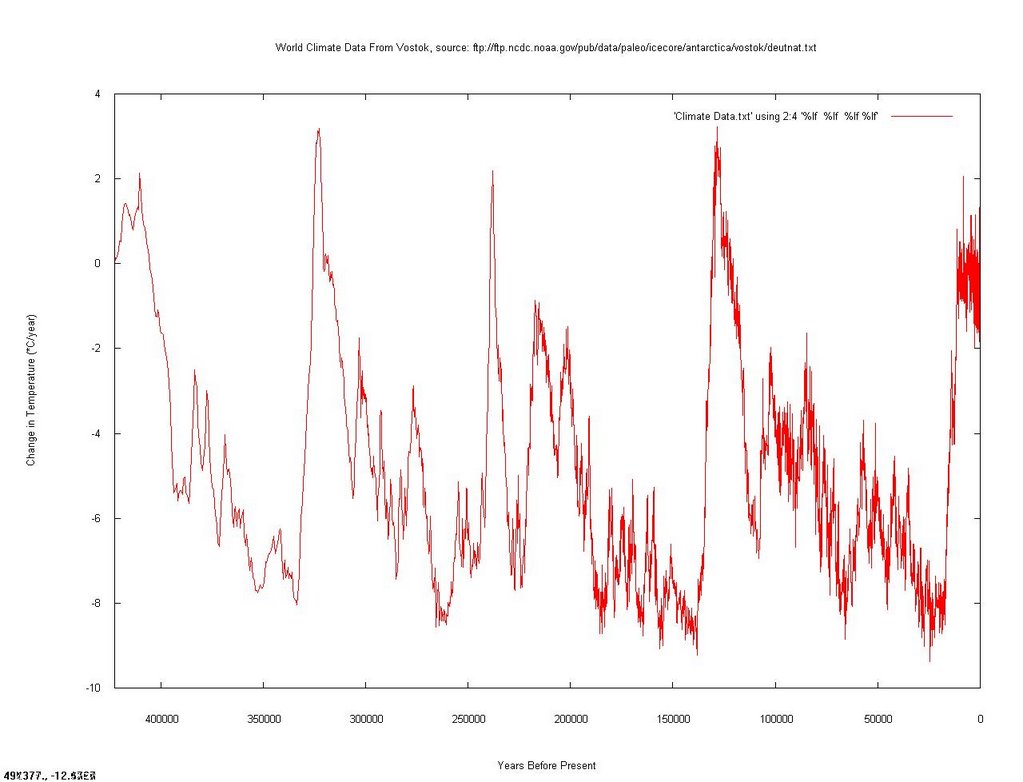
the “climatologists” will say look at the very end , the data is irrefutable.
This table is pure garbage.
If you go to about 230,000 years ago where the climate change is about -2 degrees C per year, up to about 20,000 years ago where it goes back to about -2 degrees C per year, every year in between the temperature dropped on average about 5 degrees per year. That means that 230,000 years ago the temperature on the Earth was about 1,000,000 degrees celcius. I don’t think so.
smarty pants:
“This table is pure garbage.”
Follow the link and read the comments by “chance” and then come back and spew some more garbage.
Head…..meet Ass.
Trev , see the comments to the article . ” The vertical axis is the difference in temperature from today , not annual change .I retract my criticism ….”
The proper way to read the chart is difference from current temperature, I believe…..
The left hand label would appear to be open to misinterpretation.
Trevor Good:
ROFL!!
Great mathematical interpretation, Braniac.
And way to prove that liberal arts and non-technical types should be summarily ignored in matters scientific, technical and mathematical.
Since you find simple graphing to be an Inconvenient Truth, why not go back to watching Uncle Al’s movie.
Why is it the Kyoto disciples cannot figure out that weather changes in the short term and in the long term? By the way if you really want to tick them off just ask them if this really isn’t just a case of evolution at work?
I’m reading the chart as a delta from a baseline normalized value, not as a year-over-year absolute change. Must be the economics training.
However, commenter “Stephen” is correct: the left-hand y-axis is poorly (very poorly) labeled. The giveaway as to its real interpretation is the beginning of the time-series — the first data point starts at “zero,” telling me that it’s a delta series from a known starting point. If you give it the ol’ evil eye and put a trend line through it, the whole series appears to be trending roughly downwards over geologic time, with spikes (such as our era) going in the opposite direction. I imagine this’ll continue until the Sun starts burning off its remaining hydrogen and leaving its main sequence, at which time it will start to swell and the world will grow much hotter.
Anybody know where the raw data series is? I’m thinkin’ it’d be fun to do the statistics on it…
Just think of how many hospitals we could build with the money wasted so far on a lie concocted by one of the most devious socialists since Stalin/Mao etc, one Maurice Strong. This piece of shit has started the ball rolling on the biggest theft there will ever be and the parrots that keep his bullshit going will some day have to look at their children and explaain why they wasted billions on a non existant problem. Oh but think of your grandchildren as Susuki would say, well I would be so ashamed to have been in on this scam. But lieberals have no shame, thats why they keep doing what they do best STEAL MONEY!
According to the graph we seem to be on the cusp of a cyclic downturn in global temperature. However the time span shown on the graph would mean that the next four or five generations have nothing to worry about whereas the twentieth generation from now will be wearing fur coats again and they are the ones that’ll have to deal with the PETA.
GArth, I think you will find links to the real data at the Junkman’s page junkscience.com.
As to the graphm, there appears to be a petty strong 105k year periodicity to this.
Hey, anyone wanna buy a carbon credit?
Garth… The Data is NOAA, based upon drill cores into the ice of Antarctica.
try this link
ftp://ftp.ncdc.noaa.gov/pub/data/paleo/icecore/antarctica/vostok/deutnat.txt
Remember the dinosaurs!! Canada was subtropical with steamy lowland swamps. This was followed by an ice age–and the cycles go on and on!
Trevor . . since basic arithmetic doesn’t seem to be your strength, grab yourself a beer or two and listen:
http://www.officiallyscrewed.com/blog/?p=765
Even Kyotoistas and EnviroJihadis can learn just by listening.
The good news is that Trevor Good can say that he is now an expert in correctly reading 2 (or several) types of graphs in his resume.
You’ve studied all the data on GW and are a firm believer in AGW aren’t you Trevor?
ignore the moonbat troll…they have been wrong on every environmental issue since woodstock…too much lsd I guess…the last moonbat I ever listened to was fruit fly the trough wallower, when he was whining about the coming ice age…and why are we still listening to poets and guitar players when it comes to nuclear power???? totally INSANE!
This graph just proves there have been major surges in SUV sales at regular intervals . . . 350,000 years ago, 250,000 years ago and 15,000 years ago.
So what part of global warming don’t people get ?
Rises in CO2 always precede rising temperatures.
Suzuki has said so.
He has said it 3 times.
It must be true.
A graph without supporting information is useless, as is this one.
What you see by the big peaks are normal peaks in an ice age which we are in. What you need to look at is all the red at the far right where temperatures ar no longer dropping. You haven’t stumbled across hidden proof of no climate change just a graph that needs to be interpreted. The planet goes through ice ages and hot houses. Like I already said this is an ice age, where average global temperaures are around 2 celsius ( an average of temperatures from all over the planet including arctic/antarctica and equatorial regions for the whole year). When you go from an ice age to a hot house average temperatures will rise to an average of 30 celsius.
All the red on the right hand side of the graph shows a sytem that is changing. Temperatures are no longer dropping like they are supposed to in a natural cycle. These temperatures will increase over the next few centuries to peaks higher than you currently see at any point in the last 400,000 years. Its like saying last week was so cold in comparison to a year. This is just 400,000 years out of 6 billion.
If you go back several billion years you will see we had acid falling from the skies and no Oxygen and iron never rusted. Would you use this to justify doing nothing about acid rain?
Hope that clarifies this graph for everyone. Its nothing new if you ever studied earth sciences.
And just think, if peta had been around we would have had protests of people in purple suits trying to save them. Congrats to Baird to say canada would not be party to a carbon credit world wide credit scam. As Stelmach says that is just a license to pollute.
Awwww cummon don’t let rational assesment of all the data stop a good old fashoned left wing hyteria cause!
Cummon, join the moonbats give those emotions a work out…adopt hysteria as you tool for change.
yes,I studied earth science and not junk science and the first one that comes to mind is that it cant rain without dust or smoke in the air.Thats a given.The great push to stop both has resulted in horrific storms when either of these two are present.During the manufacturing age in America it was a common complaint that the weekends were rainy,just when the workers wanted to go to the beach.Then the clouds would clear on the weekdays and be rainy again on the weekend.If you dont believe me,read your history books or listen to the people that lived at that time.
Kate you are so smart…you like a printing press…hahaha wannbe reporter!!!!
Kate you are so smart…you like a printing press…hahaha wannbe reporter!!!!
Jay, is this the same Jay as in “Jay and Silent Bob”? If so then that explains your frikkin’ ignorance in reading the chart. Only you could look at a chart with a baseline of 400,000 years and notice a change in the last few years. Maybe you can also explain how the polar cap on Mars is receeding, coincidently with the change in the sun. Please go back to wherever you came from and stuff more “Suzuki For PM” envelopes.
Last week I saw a similar graph/chart at the Tyrell Museun for the Drumheller area. We are just coming out of an ice age and CO2 was much higher than it is today.
Jay… congratulations.. you make a wonderful Suzukite….
Look only at the graph, and not the data behind it….
If you had looked at the underlying data, you would see the first hundred points are about ten years apart (the ice is not as compressed here so the resolution is better) .. Later on you will see a spread of 100 years a point, moving forward to 500 years a point as the ice compresses under its own weight…
Like the Dionites, Suzukites you only see what you want to see…
Jay rockets off into berserk moonbattery, wagging his finger and preaching:
“Temperatures are no longer dropping like they are supposed to in a natural cycle. These temperatures will increase over the next few centuries to peaks higher than you currently see at any point in the last 400,000 years.”
What is the basis for this rather bold, in fact wild, prediction? I’ve been paying attention and reading all I can find, there’s still no evidence of abnormal temperature rise or sea level rise. I guess my problem is I haven’t seen that politician Al Gore’s movie yet.
Global Warming, er, Climate Change (because it’s cold today) is hanging over our heads like an axe. We all must focus all of our attention and resources on this for every minute of every day.
Or until a bimbo ho dies… in which case… “climate change, shlimate change….”
I’m killing myself laughing at the news coverage tonight. People get what they demand from the media and our leaders. As a society, we are a joke.
Now we know… Global Warming is nothing more than a media created panic inspiring filler…. in between ‘real’ news like the passing of a centrefold.
Disproving “Global WARMING” using the “Vostok ANTARCTIC Ice” cores!!!
Not fair Kate. You should have used Greenland and Arctic ice cores.
There, you see, Kate is a latent ‘hemispherist’.
Harumph!
God, too funny. I’ve saved the page source for posterity sake. I just can’t get over the fact that SDA (and its more illiterate minions in the comments section) have cited a graph from a study that proves a link between increased CO2 levels and global temperature.
But here’s the kicker, you pseudo scientists, you armchair philosphers who disdain academia (except apparently when you — mistakenly — think it supports your cause), who’ve probably never even heard of EBSCOHOST, cite a graph from a study that contains these gems of quotes:
“Present-day atmospheric burdens of these two important greenhouse gases seem to have been unprecedented during the past 420,000 years.” p.429
“The extension of the greenhouse-gas record shows that presentday levels of CO2…are unprecedented during the past 420 kyr.” p.433
LOL. Go ahead. Read your chart however you like. But the people who collected the data apparently disagree with your interpretation.
*Page numbers listed from article cited as original source within text file cited in graph.
Yes there were ice ages and interglacials. This isn’t news. As a material for a two minute hate it’s scraping the bottom of the barrel isn’t it. Doesn’t somebody have quote from a PR consultant who works for Exxon or something?
PS.
Fark is having a photoshop contest that you guys would like. The theme is “Scientists say were to blame for global warming. Pass the buck and photoshop some other reasons why things are getting hotter.”
Go to blahblahblah dot fark dot com and scroll down. Or in firefox hit control+f and search for “getting hotter”
Yes Jose, corporations do fund research.
Why are they any less credible than “scientists” dependant on government grants for research? No man-made global warming no more grants.
Toronto Star reporting new Legere Poll Conservatives 38 Liberals 31. Climate could be heating up some more.
Toronto Star reporting new Legere Poll Conservatives 38 Liberals 31.
So, the media flood the zone with global warming hype and articles slagging Harper as a climate change denier – and the Conservatives go up in the polls.
I sometimes really do think there are benefits to having the media so out of touch with typical Canadians. If they’re only a little out of touch it’s harmful, but when they’re bug-eyed batty over something they only make Harper look responsible and trustworthy in an asylum of nutcases.
Jose,
Thank you for your careful analysis. It means so much coming from a blog troll.
Jay,
Thank you for your careful analysis. It means so much coming from a blog troll.
Would not Hans Island ice cores have been the most suitable?
There’s a rumour that the Lie-beral’s are plotting to invade Hans Island, hoping that their gray matter will deteriorate at a slower pace if they dwell in a colder climate.
Sorry mitrandir, are you making fun of those who know that the left are idiots and liars or are you being sarcastic. This topic has brought the best ie:Tim Ball, out of the shadows of knowledge and it has also brought the buffoons and out right liars out from under their ho’s heels ie; algore, davidthesqueakie, and an assortment of other miscreants that think their 40 years on this planet give them licence to spew shit about things more complicated than their thermostats that they obviously hav’nt learned to run yet.
Kate
Please forgive the length of this comment.
I think there might be enough information available from main stream climate scientists (those contributing data to the IPCC) to make a case for urging if not caution then prudence in in our approach to dealing with the global warming/climate change issue. It might at least be possible to reduce some of the hysteria around this issue by emphasizing the doubts expressed by these scientists and even that would be worthwile For example, a bit from an article in the Boston Review “Phaeton’s Reins” by Kerry Emanuel has sections like this
“Why the Climate Problem is Difficult
This basic climate physics is entirely uncontroversial among scientists. And if one could change the concentration of a single greenhouse gas while holding the rest of the system (except its temperature) fixed, it would be simple to calculate the corresponding change in surface temperature. For example, doubling the concentration of CO2 would raise the average surface temperature by about 1.4°F, enough to detect but probably not enough to cause serious problems. Almost all the controversy arises from the fact that in reality, changing any single greenhouse gas will indirectly cause other components of the system to change as well, thus yielding additional changes. These knock-on effects are known as feedbacks,”
He goes on to talk about the difficulties presented by the behaviour of clouds and water vapour and later about the about the uncertainties that are introduced by the effect of aerosols
“A further complication in this already complex picture comes from anthropogenic aerosols—small solid or liquid particles suspended in the atmosphere. Industrial activity and biomass burning have contributed to large increases in the aerosol content of the atmosphere, and this is thought also to have had a large effect on climate.”
my note
(The chart provided in the latest update to the SPM report shows how the radiative effect of CO2 is measured at +1.6 W/m2 (watts per square meter). A positive value because it increases global temperatures.
Aerosols have a comined effect of – 1.3 W/m2. A negative effect or forcing causing global temperatures to cool. Almost balancing the CO2 effect.)
“Important uncertainties enter the picture, then, with water (especially clouds) and airborne particulates. But the uncertainties actually go much deeper: indeed, to understand long-term climate change, it is essential to appreciate that detailed forecasts cannot, even in principle, be made beyond a few weeks. That is because the climate system, at least on short time scales, is chaotic.”
His article describes how scientists have dealt with these issues in arriving at the “consensus”.
I found the article at realclimate.org which is a forum for climate scientists. It was well received except for the bit about Science, Politics and the Media – for example his take on what followed from 1988 when
“James Hansen, the director of NASA’s Goddard Institute for Space Studies, set off a firestorm of controversy by testifying before Congress that he was virtually certain that a global-warming signal had emerged from the background climate variability.”
“At roughly this time, radical environmental groups and a handful of scientists influenced by them leapt into the fray with rather obvious ulterior motives. This jump-started the politicization of the issue, and conservative groups, financed by auto makers and big oil, responded with counterattacks. This also marked the onset of an interesting and disturbing phenomenon that continues to this day. A very small number of climate scientists adopted dogmatic positions and in so doing lost credibility among the vast majority who remained committed to an unbiased search for answers. On the left, an argument emerged urging fellow scientists to deliberately exaggerate their findings so as to galvanize an apathetic public, an idea that, fortunately, failed in the scientific arena but which took root in Hollywood, culminating in the 2004 release of The Day After Tomorrow. On the right, the search began for negative feedbacks that would counter increasing greenhouse gases: imaginative ideas emerged, but they have largely failed the acid test of comparison to observations. But as the dogmatists grew increasingly alienated from the scientific mainstream, they were embraced by political groups and journalists, who thrust them into the limelight. This produced a gross distortion in the public perception of the scientific debate. Ever eager for the drama of competing dogmas, the media largely ignored mainstream scientists whose hesitations did not make good copy. As the global-warming signal continues to emerge, this soap opera is kept alive by a dwindling number of deniers constantly tapped for interviews by journalists who pretend to look for balance.”
Some responses seemed to indicate that he had tread on some toes.
The article is lengthy but is one of the most informative summaries I have read. It seemed reasonably balanced to me and given that our Prime Minister has stated that he accepts the mainsteam science perhaps it would be a good idea to try to make the discussions on the conservative side as balanced and rational as possible using the same very same science.
My conclusion at this time is that the science behind the theories can be taken to be just a creditable as the science behind many other theories and should demand our attention due to some of the inevitable and possible consequences. My concern is that we will be bamboozeled into either over reaction or inaction.
Sorry for the typos – I graduated from Hunt and Peck school of typing
yes, the scientist behind IPCC have never seen this data before. (yet) another one-line demolition of global warming.
Score:
bloggers: 1,000
mainstream “scientists”: 0
The vostok Ice Core’s are data that get used in multiple studies.
Here is an abstract of one the, in your language, “proves” that C02 concentrations rose in the past AFTER the warming started.
http://www.ncdc.noaa.gov/paleo/vostokco2.html
There are others.
The greenhouse effect is real, without it we would all be living in weather that was on average 34C colder, the earth without an atmosphere.
But it really isnt clear what the main driver is…the debate is really just happening and there are competing theories….Is there some manmade effect….sure….is it the majority, will it cause runaway heating? Doesnt seem to be support for that….
By the way St James Hansen predicted we would have a “mega el nino” this year, he predicted it in April…he was one of the few predicting it and guess what…he wasnt correct….maybe his temperature predictions 10 years out arent correct either…..
Climate change killed the dinosours and I’m fairly sure that wasn’t man-made.
I guess Mithrandir takes exception to common folk like us “illiterate minions” questioning the science which he subscribes to. So I suppose I would have nothing to offer, other than being an obtuse ignoramus, when I say that CO2 seems to be really letting us down this current interglacial period. I mean looking at the pleasant highs attained in those previous millenniums, this go around seems to be a real whimper. What are we doing wrong this time?
I’m coming out with a scientific theory to explain how man is NOW causing the sun to set at night.
Funny, but the chart also looks alot like that one.
Dion proposes Canada purchase overseas Kyoto credits
Get ready to pay for hot air fellow Canadians. Sheesh. Will this Ponzi scam of the century never stop?
[PoliticsWatch updated 5:45 p.m., February 8, 2007]
Liberal Leader Stephane Dion
OTTAWA — Liberal Leader Stephane Dion said Thursday that he would create a $5 billion fund that could be used to purchase green international credits to help Canada meet its Kyoto targets.
Well Schwarze, seeing as how I actually read the “original source” of that chart, and seeing as how that is what is put out by you “illiterate minions” when you question the science, and seeing as how it says that “presentday levels of CO2…are unprecedented during the past 420 kyr”, then yes, I take exception.
🙂
My God! All the better things they could do philanthropically with $5 billion dollars. That idiot Stephane. He isn’t even funny anymore!