Why this blog?
Until this moment I have been forced to listen while media and politicians alike have told me "what Canadians think". In all that time they never once asked.
This is just the voice of an ordinary Canadian yelling back at the radio -
"You don't speak for me."
email Kate
Goes to a private
mailserver in Europe.
I can't answer or use every tip, but all are appreciated!


Katewerk Art
Support SDA
Paypal:
Etransfers:
katewerk(at)sasktel.net
Not a registered charity.
I cannot issue tax receipts
Favourites/Resources
Instapundit
The Federalist
Powerline Blog
Babylon Bee
American Thinker
Legal Insurrection
Mark Steyn
American Greatness
Google Newspaper Archive
Pipeline Online
David Thompson
Podcasts
Steve Bannon's War Room
Scott Adams
Dark Horse
Michael Malice
Timcast
@Social
@Andy Ngo
@Cernovich
@Jack Posobeic
@IanMilesCheong
@AlinaChan
@YuriDeigin
@GlenGreenwald
@MattTaibbi
Support Our Advertisers

Sweetwater

Polar Bear Evolution

Email the Author
Wind Rain Temp

Seismic Map
What They Say About SDA
"Smalldeadanimals doesn't speak for the people of Saskatchewan" - Former Sask Premier Lorne Calvert
"I got so much traffic after your post my web host asked me to buy a larger traffic allowance." - Dr.Ross McKitrick
Holy hell, woman. When you send someone traffic, you send someone TRAFFIC.My hosting provider thought I was being DDoSed. - Sean McCormick
"The New York Times link to me yesterday [...] generated one-fifth of the traffic I normally get from a link from Small Dead Animals." - Kathy Shaidle
"You may be a nasty right winger, but you're not nasty all the time!" - Warren Kinsella
"Go back to collecting your welfare livelihood. - "Michael E. Zilkowsky
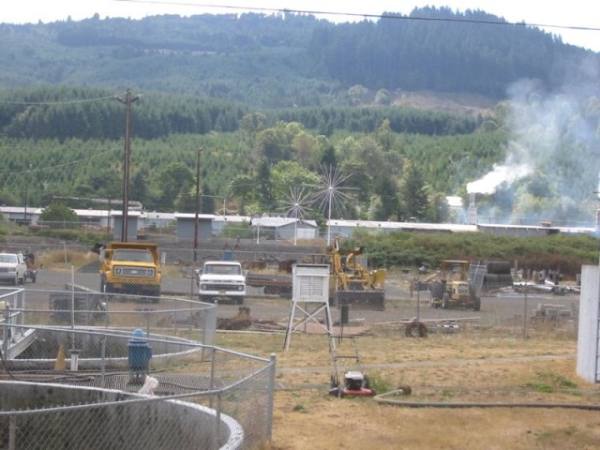

Sewage treatment plant? Nice!
Wonder if they put a light bulb in there, as they sometimes do?
something stinks about the sound of settled science.
Assuming that the plant operates 24/7, 365 days a year, you might see slightly elevated temperatures during the winter months. However, any additional increases would simply subtract out as background.
Given that the graph clearly shows a warming trend over the past x number of years at this particular site (the print is too small to read the units on the x-axis).
So what exactly is the problem with this particular weather station?
Sean . . if you are too stupid to figure it out then you are not worth the time to explain it.
Go ask a five year old.
Wonder if they have a GHG sensor sucking up all that methane?
Lemme see Sean, there’s the asphalt driveway, couple factories close by, machinery, dead grass, and nice warm poo in those tanks. Plus increased humidity and etc. Temperature will vary from changing fluid levels in the tanks too. More is warmer than less.
You can’t measure a temperature representative of the surrounding area at that spot.
Like I said, it would all come out as backgroud, but the increasing trend in temperature would still be there, maybe just a bit lower overall, but still increasing.
That is unless you can show that the surrounding area has been contributing an increasing amount of heat with increasing time, then it would discount the observed trend.
So what in that picture would explain the observed increase in temperature? Fred do you know?
What James Hansen and the Kult are really saying is;
It doesn’t matter. Doesn’t matter if the science is all phony —- we will adjust the data with al-gore-isms. Trust us. No you cannot see the data. (As Steve McIntyre found out, but proved the eco-fanatics wrong anyways)
Remember Chtistine Stewart ? Minister of the environment —- swallowed the Suzuki, Gore, Strong line. Hook, line and sinker. Her boss, Chretien had bad advisers and the rest is history;
[The politician nominally in charge of all this is Environment Minister Christine Stewart. Whether Ms. Stewart fully understands what’s going on around her is unknown, but during a recent visit with the editorial board of the Calgary Herald she certainly demonstrated her conversion to the religion of global warming.
Ms. Stewart said that, ‘as minister of the environment, I am very worried about global warming,’ which for a politician isn’t saying much. Politicians are habitually ‘very worried’ about one thing or another. The trouble starts when they use their power to fix problems they’re worried about, even if the problems don’t exist. Ms. Stewart said she’s prepared to do exactly that. ‘No matter if the science is all phony,’ she said, ‘there are collateral environmental benefits.’
Environment Canada, therefore, is prepared to act on global warming even if there’s no such thing as global warming. On the strength of phony science, the federal government would still be willing to impose new taxes on energy consumption, cut economic growth, reduce our standard of living, and create bookshelves filled with new regulation governing most facets of the lives of Canadians.
In another statement quoted by the Herald, Ms. Stewart gave another reason for adopting the religion of global warming. ‘Climate change [provides] the greatest chance to bring about justice and equality in the world.’ Here she gets closer to the core motivation of some of the leading global warming activists. Where socialism’s attempt at a global redistribution of wealth ended in economic catastrophe, global warming is being wheeled in as the next new economic crusade.] Terrence Corcoran
http://www.sepp.org/Archive/reality/realagenda.html
The biggest Kult the world has ever seen.
exothermic reactions are the core of sewage treatment. Huge amounts of heat energy will be dispersed into the immediate area. The temperatures at that site will be skewed HIGHER because of this.
Biggest impact will be in night time temperatures being higher.
The site will report biased higher temperatures which is then interpreted by the Faith Based Science, The Believers Crowd as “proof” of the AGW theory.
Now, how about you explain that gobbly-gook statement you made “it would all come out as background, but the increasing trend in temperature would still be there, maybe just a bit lower overall, but still increasing”
Sean, if the infrastructure and operating conditions have been constant at this site for the last “x” many years, than your question would be relatively reasonable. The temperature graph is too small for me to read the time scale, but it looks like it is a record of a few decades…you aren’t going to suggest to me that this site has been exactly the same for all those decades, can you?
Sorry, I should have been a bit more inquisitive…the main website shows that this graph goes back to 1900. The neighbouring conditions have not been like this since 1900.
Which begs a question…the gallery of photos shows the CURRENT location and conditions…but what were the PREVIOUS locations and conditions like? Inconsistent recording methods, inconsistent recording equipment accuracy and inconsistent local conditions for the last 100 years of data…yup, sounds like something to reasonable to base multi-billion dollar decisions on!
Sean, the temperature at this site will change based on the sewage levels in the tanks. Meaning any trend could be that, not the climate. Which is why its a bad location, and why whoever put it there should be demoted to poo shoveler for wasting public money.
These things are obvious Sean, what’s your issue here?
I agree that it isn’t the greatest spot. However, what I think is being missed here is that despite the increase in the local temperature that might be occurring from the immediate surroundings the graph clearly shows an increasing trend in temperature with time.
While the actual temperatures might be altered by the surroundings the increase in the average relative temperature is still potentially valid. However, the previous poster is correct, what were the conditions of the site over time and what influence would they have?
That being said, I don’t see how one can argue that the observed increase in relative temperature is solely because of the manure and/or the grass and/or the asphalt. Those factors would potentially influence the temperature at certain times, under certain conditions, however, they wouldn’t result in a continual increase in the local temperature.
Finally, even if you could somehow explain the relative increase with time at this one site, its just that, one site and no sane person or scientist would base their conclusions on one site in particular. So it is disingenuous to claim that his one photo, or even a collection of several photos, invalidates the independent results of hundreds of researchers.
Phantom: Usually I like these posts by Kate, but your comment needs a little bit of clarification. Eeyore showed in the previous post that the site is over 100 years old. You then state that “why whoever put it there should be demoted to poo shoveler for wasting public money”.
Do you really think the keeper there is about 120 years old but still working on his site?
Don’t you think that a more logical explanation is that perhaps the infrastructure grew up around the site over the last 100 years and in fact it might have been a resonable site when it was established for that time.
You would think that somebody would have come across these problems by now and decided to do something about it, provided they are not too busy shoveling poo 😉 .
Oh, Eeyore, I agree the site looks like a poor place to make a billion dollar decision on, but the thermodynamics of CO2 make for much more reasonable decisions.
Regards,
John
John, your link attaches to what NASA would like to do in the future, not what is currently being done.
As Eeyore says, obviously that station hasn’t been where it is for 120 years. I’d like to fire the guy who put it at its present location.
Your thermodynamics of CO2 can’t stand alone without -measurements-, which as we have been seeing are not being made honestly of late.
Which gets to Sean’s objection. Is the average local temperature increasing, or have little elves been moving the sensor to ever warmer locations?
Photographic evidence argues for the latter explanation, eh? All that’s missing is an air conditioner outlet.
Phantom, I guess that the 80 some odd photos are of proposed sites that have been photo-shopped?
Why do you say it is obvious that the station has been changed? Looking at the lat/long record for the site I don’t see change (except possible some surveying / geo-reference differences).
Regarding CO2, so you now accept that the thermodynamics of the molecule will cause warming? Progress at last. 😉
Have a good weekend.
John
John, Sean and Phantom:
We don’t know the history of the monitoring equipment (when it was changed, what was in place at what time, what was the accuracy of the equipment at different times), we don’t know the history of the moves of the monitoring equipment (could it have been moved a few hundred meters here or there to get out of the way of construction), we don’t know the history of the infrastructure construction (when did they build the sewage plant, when did they pave the parking lot, when did the adjacent industry spring up), etc. and ad nauseum.
One can be fairly certain that the sewage plant and parking lot were built within the last 30-60 years or so…what were the conditions like before then? If you could document the history of the site conditions and adjust the readings to take into account the “heat island” effect of the infrastructure, we might get a different chart of temperatures…or not.
All you can say with certainty is…the temperature readings at this site must be taken with a grain of salt and cannot be relied upon as a reliable long-term indication of temperature trends.
And this, I believe, is the whole point of this series of postings by Kate. Garbage in equals garbage out.
CO2 is not a pollutant. It is plant food.
http://homeharvest.com/carbondioxideenrichment.htm
John, they fixed 80 sites? Kewl. How many haven’t they fixed yet? This one for sure, eh?.
Eeyore has it with his GIGO comment.
CO2 warming, I’m not an atmospheric scientist, I only know what I read on the web. My problem is what I read on the web is 98% crap.
As I’ve said to you many times the people pushing climate change the hardest are people I know to be liars and scoundrels from other issues. With gazillions of dollars and the personal freedom of billions at stake (Indian farmers stuck with treadle pumps on another link), I’m inclined to drag my heels shall we say.
@Sean S:
This retool of your earlier comment (at 2:05 PM) may explain why so much criticism is made of the weather stations, at times with heat:
“I agree that Enron didn’t have the most conservative accounting policies. However, what I think is being missed here is that despite the increase in the earnings that might be occurring from those partnerships clearly shows an increasing growth trend with time.
“While the actual earnings might be altered by the use of partnerships the increase in the average earnings is still potentially valid. However, the prosecutors are correct, what were the conditions of Enron’s accounts over time and what influence would they have?
“That being said, I don’t see how one can argue that the observed increase in Enron’s earnings is solely because of the manure […]. Those factors would potentially influence the earnings at certain times, under certain conditions, however, they wouldn’t result in a continual increase in the long-term earnings.
“Finally, even if you could somehow explain the relative increase with time during that one quarter, its just that, one quarter and no sane person or securities analyst would base their conclusions on one irregularity in particular. So it is disingenuous to claim that this one scandal, or even a collection of several accounting irregularities, invalidates the independent results of hundreds of researchers.”
I realize that, by cutting and pasting, I’m making an analogy, which does carry less force than a logical argument. The paste job above, though, should indicate why emotions get rising with respect to this issue.
“CO2 is not a pollutant. It is plant food.
http://homeharvest.com/carbondioxideenrichment.htm
Posted by: alan at September 7, 2007 4:05 PM”
Oh would you please crack a book and learn the science behind the warming. When I say book I don’t mean what you find on the Bull O’Reilly reading list.
HA, WHAT WAS I THINKING? As if people who watch Bull O’Reilly would have a need for a reading list.
Ok I usually tell people to read “The Weather Makers” by Tim Flannery and I don’t normally do this, but in your case I’ll make an exception. I’ll advise you to watch “Global Warming for Dummies” A.K.A. “An Inconvenient Truth” and you’ll learn why CO2 in increased concentrations is toxic to the current ecosystem and economy.
“I’ll advise you to watch “Global Warming for Dummies” A.K.A. “An Inconvenient Truth.”
You are right it is for Dummies. There are so many proven lies in that Pulp science fiction movie any Dummy who believes it deserves to be fleeced.
Ok so now lets look at the picture. Isn’t it pretty with he trees in the background. But what is it a picture of? It’s got a white louvered box, but what is that white louvered box for and who owns it? Are you sure and why?
Now the reality. It’s called a cotton-region shelter. Anyone who needs accurate local temperatures can buy one of these things and put it anywhere they like.
This goes for people who study weather and for others who need to know how much chlorine to add to water in order to purify it. Seeing chlorine tends to evaporate depending on temperature, it’s sometimes handy to know how warm or cold the air is.
novalynx.com/380-605.html see you too can put one of these things anywhere and take all the pictures of it you want.
A SEWAGE TREATMENT PLANT the same place where AL GORE and the eco-wackos get their crazy ideas from RECYCLE GREENPEACE
Are we feeding Alby now?
I’ll advise you to watch “Global Warming for Dummies” A.K.A. “An Inconvenient Truth” and you’ll learn why CO2 in increased concentrations is toxic to the current ecosystem and economy.
Posted by: albatros39a at September 7, 2007 5:32 PM .
The only thing it is toxic to Alby,is the twits who fall for it and give the eco-cultists their money. But then,I’m don’t really concerned about the species going extinct anyways.
(Sorry, Phantom,maybe he will go read about the real gas that has 98% effect on climate..Hint Alby…H2O)
“maybe he will go read about the real gas that has 98% effect on climate..Hint Alby…H2O”
Ah yes Rocky, water vapour! Now can you please pass on to everyone the connection with increasing CO2 and water vapour? Or can you?
Uh oh, hung rocket!
Can YOU explain Alby, why CO2 concentrations changes LAG BY 800 years AFTER temperature changes in the ice core records?
Don’t bothe bipolarbear. We’ve dealt with this clown here before.He aint worth the keystrokes anymore.
“BipolarBear at September 7, 2007 11:45 PM”
Certainly, the answer can be found by understanding the significance of the Keeling Curve.
“Don’t bothe bipolarbear. We’ve dealt with this clown here before.He aint worth the keystrokes anymore.
Posted by: Justthinkin at September 7, 2007 11:49 PM”
I’ll take that as a “no”, you can’t explain the connection between CO2 and water vapour.
The increased CO2 creates a positive feedback system where the increased temperature caused by the increase in CO2 increases atmosphere’s capacity to hold water vapour. The increase in water vapour causes a further increase in temperature.
Comment by albatros39a blocked. [unkill][show comment]
“Comment by albatros39a blocked. [unkill][show comment]
Posted by: ural at September 8, 2007 12:57 AM”
what?
Can YOU explain Alby, why CO2 concentrations changes LAG BY 800 years AFTER temperature changes in the ice core records?
Posted by: BipolarBear at September 7, 2007 11:45 PM
I don’t mean to speak for Albatros93a, but this is currently in question. You can read about it here.
Regards,
John
John in CA:
I believe that your reference does not dispute the lag, they just claim the lag has been overestimated. The existence of any lag tends to run contrary to the AGW hypothesis.
And begging a bit of indulgence (“credits”?) for not reading all of the above posts, the problem with stating that the background conditions represent offsets or tares that can be subtracted-out is basically false. Others have noted that we do not know the specific history of the site changes. Site changes would tend to be one-time step increases that might be corrected for or they might not. Sewage treatment would not be so easy to subtract. The heat load from the plant would likely increase with time due to increases in both population and utilization of the system.
Oh man!
That was to John Cross not CA, and delete “the problem with”. These things make sense until you hit the post button.
RicardoVerde: In fact, you don’t need a leading CO2 level to be consistent with AGW. Based on what we know we would expect a lag, we can discuss more if you wish.
However I will note that the 800 year lag is (should) be given as 800 +/- 600, so it would only take a small reduction to include 0 in the confidence interval.
REgards,
John
There is more to climate changethan just temp. Too much moisture or lack of. 100 year floods every 5 years or so. Why do you think it’s not happening?