Why this blog?
Until this moment I have been forced to listen while media and politicians alike have told me "what Canadians think". In all that time they never once asked.
This is just the voice of an ordinary Canadian yelling back at the radio -
"You don't speak for me."
email Kate
Goes to a private
mailserver in Europe.
I can't answer or use every tip, but all are appreciated!


Katewerk Art
Support SDA
Paypal:
Etransfers:
katewerk(at)sasktel.net
Not a registered charity.
I cannot issue tax receipts
Favourites/Resources
Instapundit
The Federalist
Powerline Blog
Babylon Bee
American Thinker
Legal Insurrection
Mark Steyn
American Greatness
Google Newspaper Archive
Pipeline Online
David Thompson
Podcasts
Steve Bannon's War Room
Scott Adams
Dark Horse
Michael Malice
Timcast
@Social
@Andy Ngo
@Cernovich
@Jack Posobeic
@IanMilesCheong
@AlinaChan
@YuriDeigin
@GlenGreenwald
@MattTaibbi
Support Our Advertisers

Sweetwater

Don't Run

Polar Bear Evolution

Email the Author
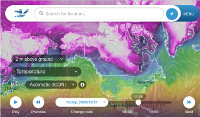
Wind Rain Temp
Seismic Map
What They Say About SDA
"Smalldeadanimals doesn't speak for the people of Saskatchewan" - Former Sask Premier Lorne Calvert
"I got so much traffic after your post my web host asked me to buy a larger traffic allowance." - Dr.Ross McKitrick
Holy hell, woman. When you send someone traffic, you send someone TRAFFIC.My hosting provider thought I was being DDoSed. - Sean McCormick
"The New York Times link to me yesterday [...] generated one-fifth of the traffic I normally get from a link from Small Dead Animals." - Kathy Shaidle
"You may be a nasty right winger, but you're not nasty all the time!" - Warren Kinsella
"Go back to collecting your welfare livelihood." - Michael E. Zilkowsky


Lovely and just in time to fully welcome the new EU arrivals from the ME.
If Bill Nye says something, then it must be true, right?
http://www.truthrevolt.org/news/bill-nye-climate-change-brought-louisiana-floods
Weather I tells ye, Dammnit, weather.
consider that Arctic sea ice began being recorded by satellite in 1979.
No wonder that the arctic ice cap was large based on the graph above, as the heat content of the ocean was at almost record lows.
Then as the heat content of the ocean increases the ice caps shrink. 2007 was a record low in ice cap size.
Since then the Arctic is has been gaining ice cover
There may not be perfect correlation but it seems like it’s pretty close.
Global Ocean Heat Content
Arctic Sea Ice Extent
Misleading line graphs
2016 is the HOTTEST year EVER … in the HISTORY of the planet ! I KNOW this to be TRUE … because NASA … a Federal Government Agency said so. And NOAA … a Federal Government Agency said so. And the Federal Government NEVER LIES! These are the same sciencitists who put a man on the moon, and warned Bush about Katrina … (but Bush did nothing to help the poor black man).
In a related story … the Secretary of State communicates on her own personal server(s) which get smashed to bits and incinerated monthly. And all Federal Government Agency heads communicate via pseudonym email accounts.
Yes, Kenji it’s the HOTTEST year they’ve EVER adjusted & recorded in their short HISTORY of measuring the planet’s temperatures.
Surface measurements, flawed as they are, are used instead of satellite measurements, which are being “adjusted” as we speak.
They are averaged for one day, then one month, then one year, then “adjusted,” aka up now, down then, and voila, the hottest year on record.
Several other datasets contradict their findings but no big deal, it’s already settled, so it’s real and so what if it isn’t really happening?
How else can we make Canada pay to pollute but not China, Mr Soros & the late Mr Strong would ask. How does that cause international socialism?
Shamrock: Surface measurements, flawed as they are, are used instead of satellite measurements, which are being “adjusted” as we speak.
Actually, both sets of data are used. As for satellites, UAHv5.6 shows a temperature trend of 0.151 ±0.064 °C/decade since December 1978, the start of the UAH data record.
I want verification that alberta was a jungle when the dinos walked the earth. oh, wait we have that.
Yes, we were wrong then, but we’re right now; until next time. It seems they’re using ground and surface measurements to refute their own satellite data, which shows.
Anyway nice try. Fair enough on the satellite measurements, but they do not show 2016 is the “hottest year on record,” ground and surface measurements do. That’s what they’re relying on to make their outlandish claims. Now they’re “improving” the quality (result) of satellite measurements.
They admit their data wasn’t accurate enough when it diverges from their predictions, that they made improper assumptions, and now we should believe their alarmism and conclusions diverging from raw data towards modelled predictions?
It doesn’t work like that, the train has left the station, lean and mean economies can’t afford government getting fat over CAGW nonsense.
The earth already warmed, and cooled many times. We dealt with it. We’ve had two thirty year periods of warming in the last 100 years. We and the polar bears got through it, and we’ve done it many times before and will do it many times again.
http://www.latimes.com/politics/essential/la-pol-sac-essential-politics-updates-cap-and-trade-auction-1471971684-htmlstory.html
Shamrock: Fair enough on the satellite measurements, but they do not show 2016 is the “hottest year on record,” ground and surface measurements do.
In fact, according to UAH, 2016 is already hotter than any year on record, and will very likely be the hottest year on record. More important, the trend is 0.151 ±0.064 °C/decade since December 1978, the start of the UAH data record.
Virtually indistinguishable – Comparing early 20th Century warming to late 20th Century warming
The warming in the early 20th century has always been a bit of a mystery. Attempts to model this warming event have mostly failed… Generally it is considered to be natural and roughly equivalent to the warming since 1950, at least in the northern hemisphere and particularly north of 60°N. We have some indications that warming in the United States was more severe in the late 1930’s than today. In particular 1936 has the most US all-time records for daily maximum temperature and 1930 is second.
Measuring the global average surface temperature accurately is problematic. Land based measurements are affected by weather station siting problems and the changing environment around long term weather stations as people have become more urbanized. Attempts at “homogenizing” the temperatures can induce a warming trend because urban areas are warmer than rural areas and many previously rural weather stations have had urban areas surround them over time. In Connolly and Connolly (2014) they point out that the unadjusted US climate network data (their Figure 5) shows that the 1930’s were at least as warm as today. However, once the data are homogenized by the National Climatic Data Center, the 1930’s are suddenly cooler (Connolly and Connolly 2014, Figure 20) than today. Further, most weather stations in the world between 1850 and the present day are in urban areas. For example, only 24.7% of the GHCN network is fully rural.
https://wattsupwiththat.com/2016/08/22/virtually-indistinguishable-comparing-early-20th-century-warming-to-late-20th-century-warming/
Of course the science is settled: natural gas produces less CO2 per unit energy than coal. The chart is in line with the overall decrease in energy consumption due to the 2007 recession, but the heat didn’t turn back up in more recent years thanks to cheap, clean natural gas. This chart clearly shows that we need more fracking!
So Zach. You would appear to be the latest “John cross” at sda. Nice try’s
jean: However, once the data are homogenized by the National Climatic Data Center
There are known discontinuities in the temperature record, so homogenization is required.
jean: Further, most weather stations in the world between 1850 and the present day are in urban areas.
Of course. You seem to be suggesting that scientists are not aware of the source of their own data. In any case, multiple methodologies support anthropogenic climate change, including surface temperature data, paleoclimatology, satellite measurements, ocean heat content, ecological changes, solar studies, planetology, and studies of how volcanoes impact the climate.
jean: However, once the data are homogenized by the National Climatic Data Center
By the way, there are statistical means that do not require homogenization that can also be used to determine the trend in data. For the Berkeley Earth methodology, see Rohde, et al., Berkeley Earth Temperature Averaging Process, Geoinformatics & Geostatistics 2013.
The same team also studied the urban heat island effect. See Wickham et al., Influence of Urban Heating on the Global Temperature Land Average using Rural Sites Identified from MODIS Classifications. Geoinformatics & Geostatistics 2013: “is consistent with no urban
heating effect over the period 1950 to 2010”.
Cherry pick to your hearts content
johnlee: Cherry pick to your hearts content
Indeed. The urban heat island effect is well-known and well-studied. Climate scientists have accounted for the effect in many different ways. The simplest is to exclude sites subject to the effect, and determine the trend from the reduced set. That’s what Wickham et al. did in their study, and they found the same overall temperature trend.
Of course, we also have data from many other sources, such as from satellites and ocean heat measurements, all showing a warming trend.
Of course there is a recent warming trend, just like there was a warming trend from 1910 to 1944, and many times before that. The climate is still recovering from the little ice age 300 years ago.
The important point is that it isn’t caused by human activities; it wasn’t then nor is it now.
This will help you understand the greater context:
https://scontent-sea1-1.xx.fbcdn.net/v/t1.0-9/13934832_1663026807353128_6556120564352318048_n.jpg?oh=73badd56f329d990aea5353fab860cab&oe=5851598A
jean: The important point is that it isn’t caused by human activities
There are a lot of influences on climate, including solar irradiance, volcanism, movements of the continents, content of the atmosphere, even impacts by comets. None of those explain the current warming trend. In addition, we can’t explain past climate without accounting for greenhouse gases, nor can we explain the current warming trend without accounting for greenhouse gases.
jean: This will help you understand the greater context
Your graph is in error because it confuses dates. The “present” used by GISP2 is 1950, the first data-point is 95 years before “present”, so the first data-point is 1855. Adjusting for that, there is strong support for anomalous warming.
http://hot-topic.co.nz/wp-content/uploads/2011/01/GISP210k480.png